Is The Gold Rally Nearing Its End?
- 14 Jul 2020
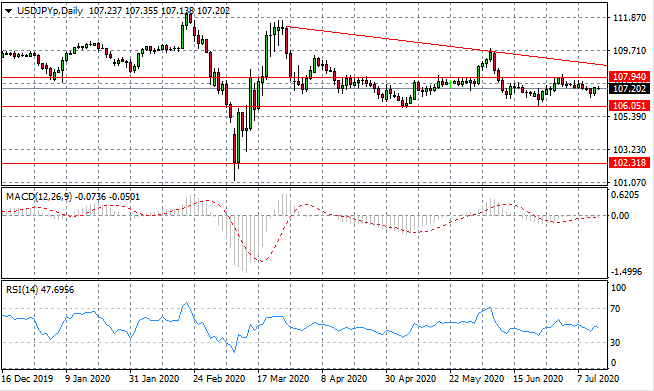
USD/JPY
The USD/JPY pair has oscillated between the 106.51 and 107.94 price levels in recent trading, with a series of small-bodied candles suggesting no real conviction from buyers or sellers. A moderate long-term downtrend has formed and buyers seem unwilling to challenge at this point. Momentum indicators have flattened in neutral/bearish territory.
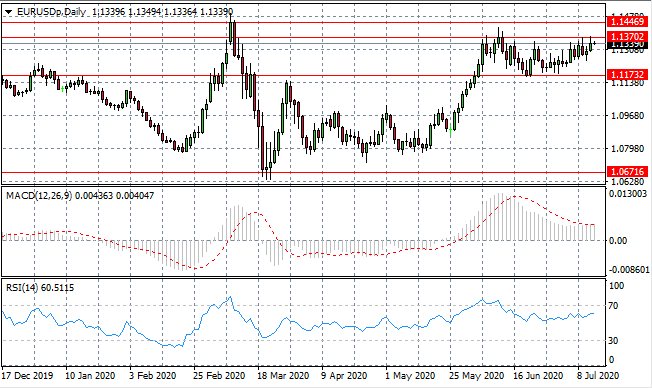
EUR/USD
Eurodollar buyers have returned and the question is whether the pair can drive a break at the 1.137 resistance line. Several touches of the resistance line have not resulted in a break as selling pressure rose. Momentum indicators have moderate upward trajectories in support of the rally.
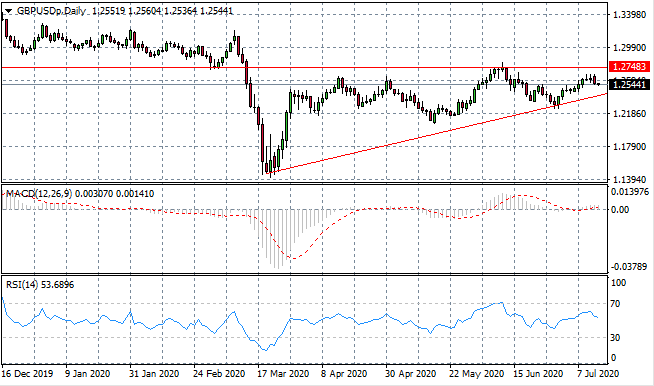
GBP/USD
The GBP/USD pair has rebounded from the ascending trendline, as price action forms an ascending triangle pattern. Sellers remain active in the pair as several oscillations will likely take place before a breakout. Momentum indicators appear to be turning bullish with RSI forming a downward trajectory.
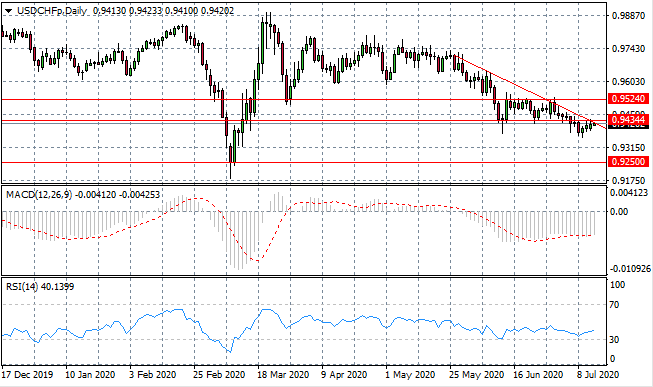
USD/CHF
The USD/CHF pair has broken a key support level at the 0.943 price line, where previously, sellers had been held. Buyers have returned to test the trendline and 0.943 support level once again. Momentum indicators are bearish with RSI flattening just above the oversold line.
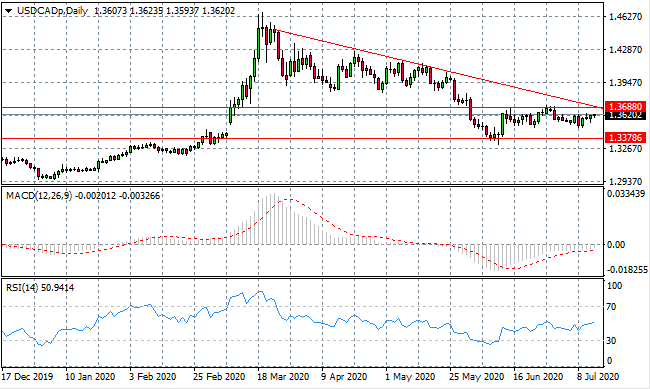
USD/CAD
The USD/CAD rejected the 1.368 resistance line as buyers have been unable to overcome the ceiling of this trading range. Another attempt is being made yet there is an established, longer-term downtrend. Momentum indicators have moderate upward trajectories.
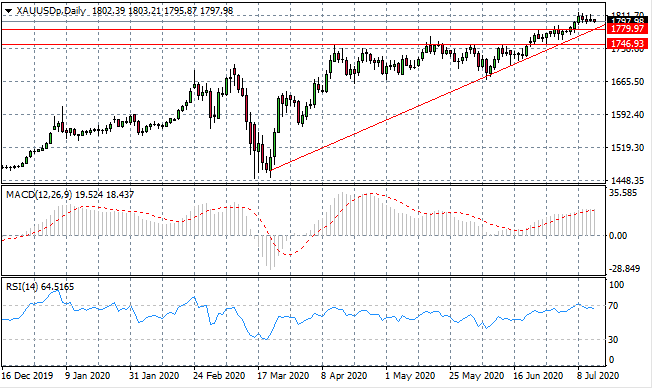
GOLD
Gold sellers have returned and the metal may move back towards the 1779.79 support level. Another support level exists at the ascending trendline and previous touches have ignited further bullish momentum. Momentum indicators are bullish yet RSI is pulling away from overbought conditions.
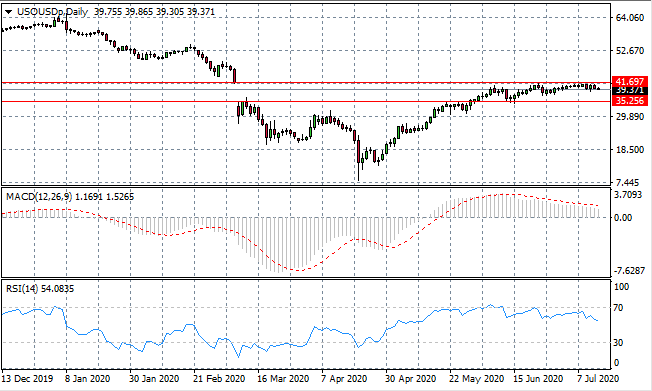
OIL
WTI appears to be making another attempt at the 41.69 resistance line despite scant conviction from buyers. A series of doji/small-bodied candles indicate that the horizontal price action will likely continue in the near-term. Momentum indicators have downward trajectories with RSI pulling away from overbought conditions.
Sign up to get started
LIQUIDITY
PROVIDERS