Australian Dollar Weakness: A Theme This Trading Week
- 28 Sep 2017
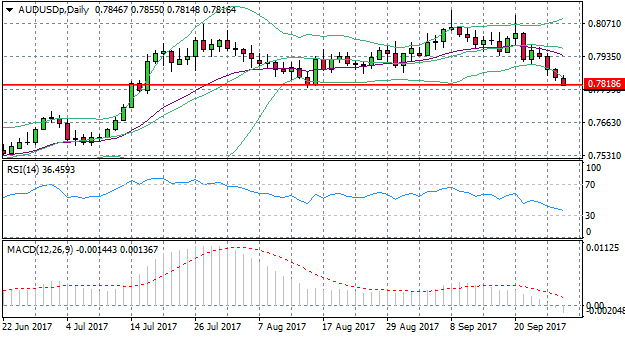
AUD/USD
The AUD/USD daily chart shows the pair testing the 0.781 price level which represents a previous support level. MACD has broken the zero line which also indicates that sentiment is bearish. However, a break of the lower Bollinger band and RSI proximity to the 30 support level suggests the current bearish trend may be reversed in the near term. Currently, however, buyers are favouring the U.S. Dollar.
Impact event: President Trump will speak at 22:00 GMT+3 and statements will likely impact the U.S. Dollar.
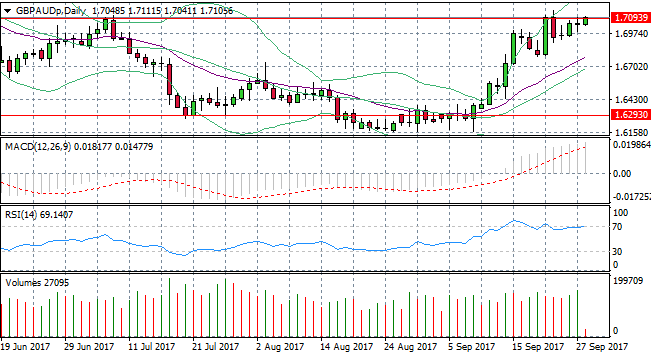
GBP/AUD
The GBP/AUD pair has had a strong bullish run since 5th September, however, indicators suggest this may not continue. The pair is currently testing a previous market top at the 1.709 price level. RSI has also reached the 70 ‘overbought’ line indicating the current trend may lose steam. If price action rejects the 1.709 resistance line, a candles closing below the 70 line will confirm the downtrend.
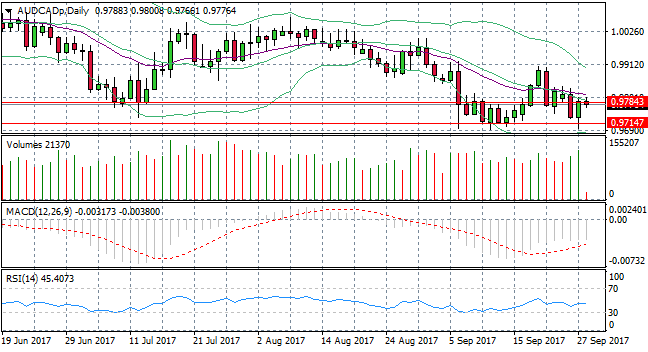
AUD/CAD
After a volatile trading week last week, the AUD/CAD has started this week on a bullish note. However, today’s trading session shows that bears have dominated during the Asian trading session and the pair is testing the 0.978 price level. If broken, price action will target the next support area at 0.971. A break of the 20-period EMA further confirms bearish momentum. RSI has flattened and MACD remains in negative territory.
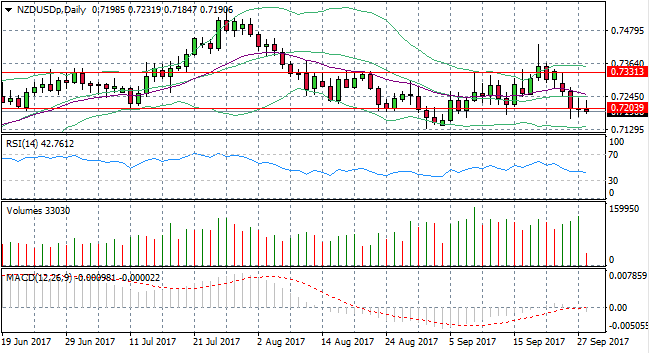
NZD/USD
The NZD/USD pair continues to test the 0.720 price level with strong selling pressure. This area represents strong support for the pair and momentum indicators suggest that a bullish reversal is a possibility. A bullish break appears imminent on MACD and RSI is approaching the 30 oversold line. The near-term direction for the pair will be determined by the pair’s ability to break or reject the 0.720 price level.