Canadian Dollar Weakness Appears To Be Reversing
- 19 Sep 2017
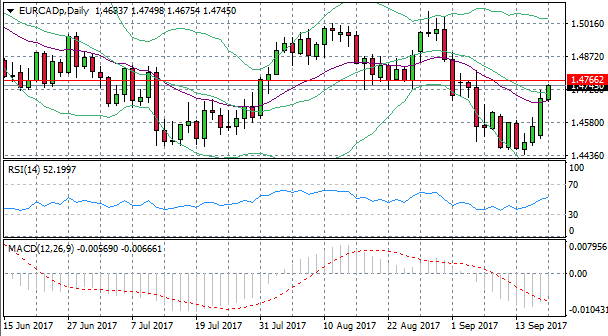
EUR/CAD
The EUR/CAD daily chart shows the pair breaking the mid-line on Bollinger and the 20-period EMA to the upside. The pair is fast approaching a previous support area at the 1.476 price level. RSI has broken the 50 support line providing confirmation of the uptrend. MACD remains below the zero line, however, is a lagging indicator.
Impact event: German ZEW Economic survey will be released at 12 GMT+3 and will impact Euro pairs.
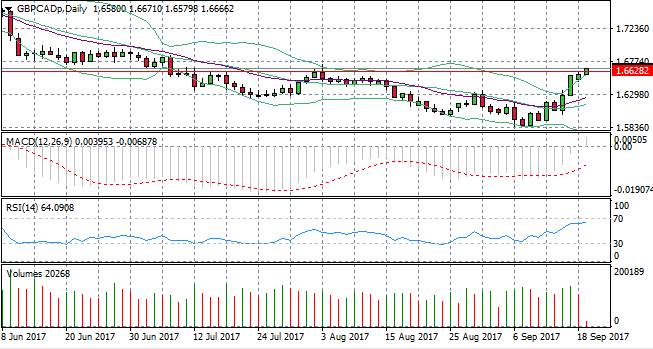
GBP/CAD
The GBP/CAD pair has broken through a previous resistance line at the 1.662 price level and MACD has broken the zero line to the upside. However, RSI has reached the 70 resistance line and there have been several breaks of the upper Bollinger band indicating the asset is overbought. With volume dropping, it seems unlikely that the uptrend will continue.
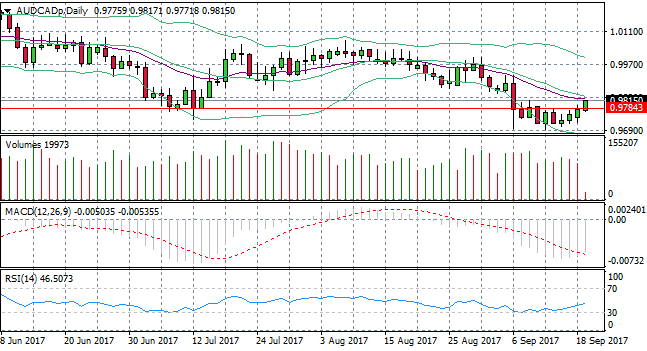
AUD/CAD
The AUD/CAD pair has broken a previous support level at the 0.978 price line. The pair is also approaching the 20-period EMA which has acted as a resistance line over the last month. RSI has turned sharply bullish, however MACD remains negative. Volume appears to be falling indicating that buyers of the pair may not find enough momentum to carry the trend much further.
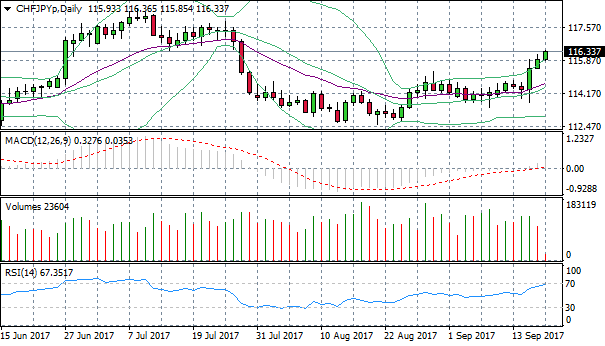
CHF/JPY
The CHF/JPY pair has broken the upper Bollinger band on three consecutive occasions. This is also in combination with RSI touching the 70 resistance line. Although MACD has broken the zero line, there appears to be little momentum carrying the pair in a strongly bullish direction. Additionally, volume is on the decline indicating waning appetite from buyers to push prices higher. A bearish reversal may be on the cards.