Major Peers Gain Amidst Yen Weakness
- 12 Sep 2017
GBP/JPY
The GBP/JPY daily chart shows a break of the 20 period EMA, with MACD fast approaching the zero line, a break to the upside would confirm the uptrend. RSI still has some upside as the pair has not reached overbought territory yet.
Impact event: U.K. Consumer Price Index data will be released at 11:30 GMT+3 and will impact all GBP pairs.

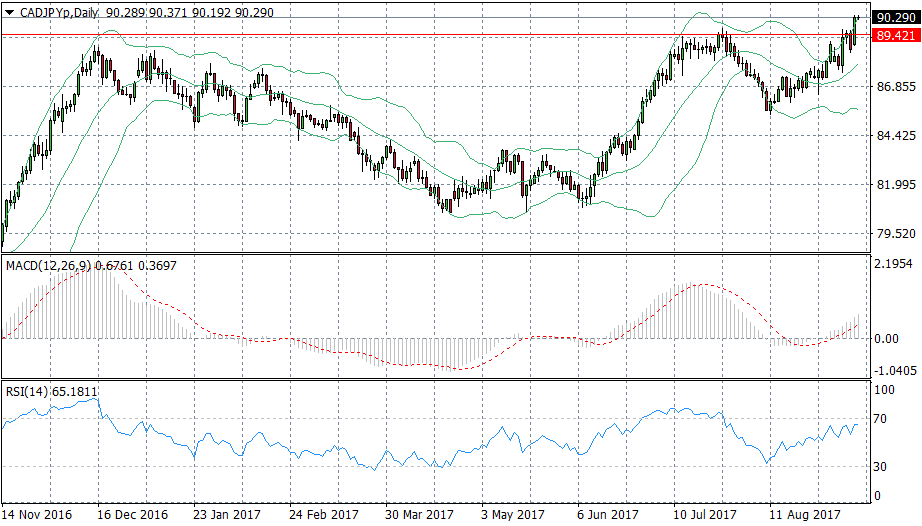
CAD/JPY
The CAD/JPY pair has surpassed a 1-year high to reach the 90.29 price level. The question is: can the bullish run be sustained? Falling oil inventories have supported the Canadian dollar. Momentum indicators suggest there is still further upside with RSI approaching but not having reached the overbought 70 line. MACD is rising further above the zero line indicating that sentiment remains positive for the pair.
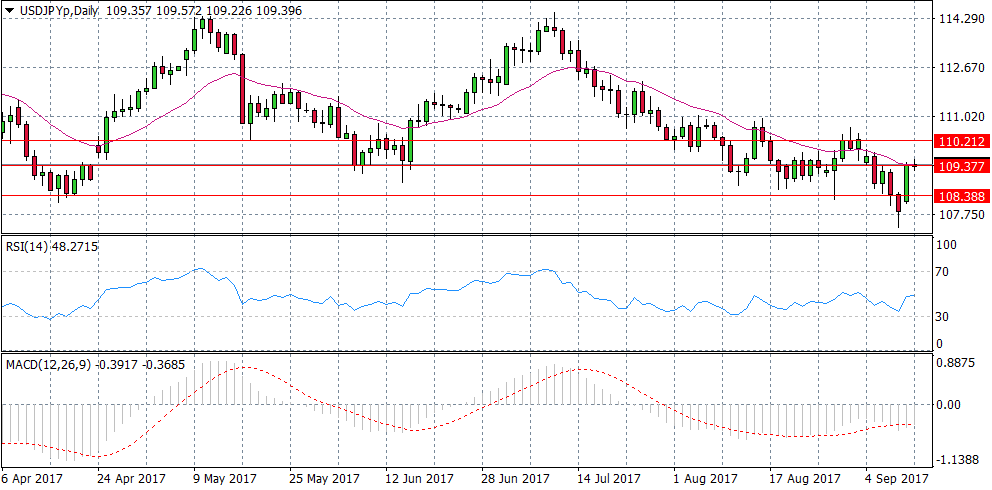
USD/JPY
The USD/JPY daily chart shows the pair testing the 109.37 price level. The pair is also testing the 20-period EMA which has acted as a resistance level in recent trading sessions. Momentum indicators appear to have a positive trajectory despite MACD remaining below the zero line. A break of the resistance line will have price action targeting the 110.21 price level.
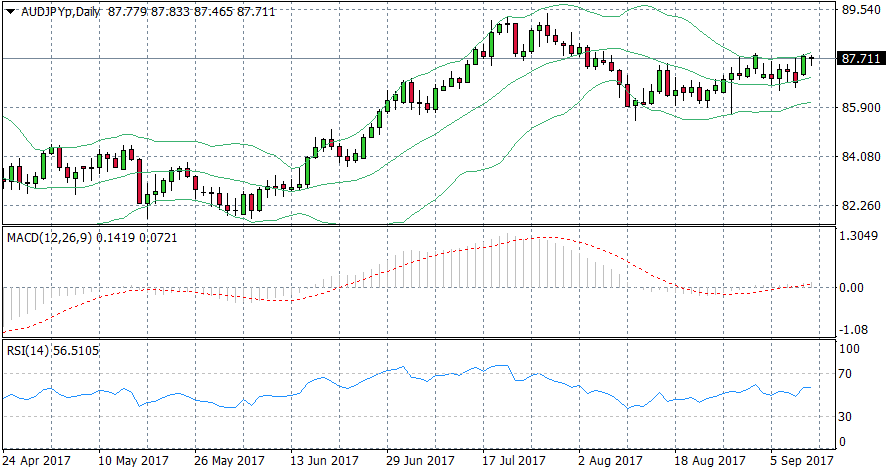
AUD/JPY
The AUD/JPY daily chart shows a M-Top pattern on the Bollinger indicator. Price action had reached a reaction high on 1st September and bounced back to the centre line only to initiate a second reaction high, which so far, appears to have bounced back towards the centre line once more. A break of the centre line would confirm the downtrend. However, there appears to be significant buying pressure in today’s trading session. Momentum indicators do not indicate strong sentiment in either direction.