AnzoCapital昂首資本:USD/CAD再次嘗試逆轉
- October 16, 2020
USD/JPY
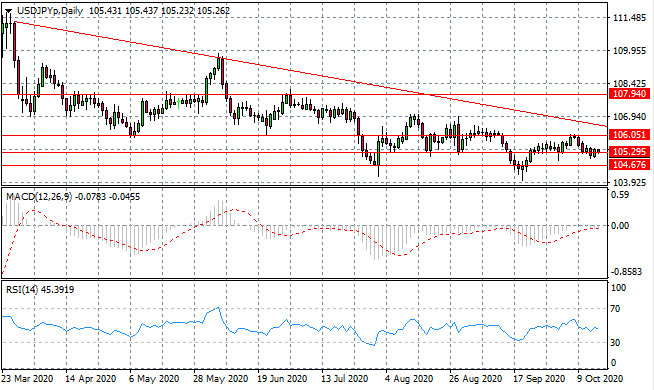
The USD/JPY pair has been unable to fully break the 105.29 support level. Oscillations are narrowing within range which generally takes place ahead of a breakout. Longer-term bearish sentiment is lingering. Momentum indicators remain in the neutral zone.
USD/JPY未能完全突破105.29支撐位。目前震蕩在區間內收窄,此舉通常在突破前出現。長期看跌情緒依舊持續。動量指標仍處於中立區。
EUR/USD
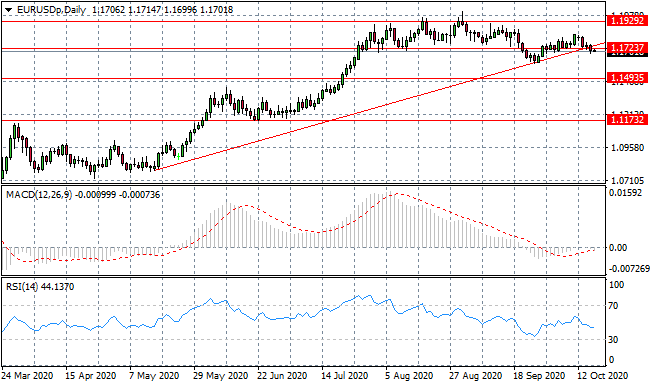
The Eurodollar has broken the ascending trendline to the downside and is testing the 1.172 support level. The break is significant and could indicate a trend change if sellers can sustain the momentum. Momentum indicators remain in bearish territory.
Eurodollar已突破上升趨勢線下行並測試1.172支撐位。此次突破意義重大,若賣方能夠保持該勢頭,可能預示著趨勢將發生變化。動量指標仍然處於看跌狀態。
GBP/USD
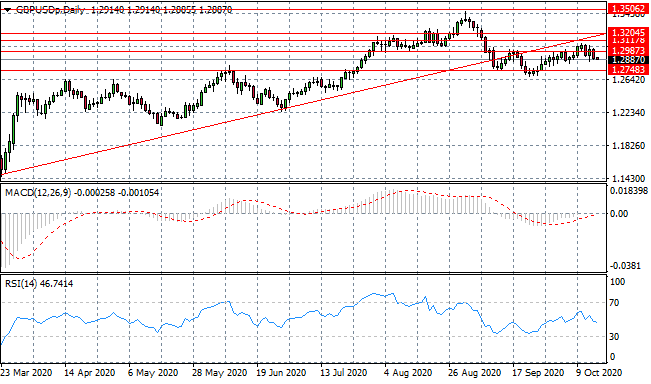
The GBP/USD pair has failed at the 1.298 trading range, as the pair begins to move sideways and may enter a period of consolidation. Fundamental factors do not currently support a long-term Sterling rally. Momentum indicators remain in bearish territory.
GBP/USD在1.298交易區間衰退,該貨幣對開始橫盤移動,可能進入盤整期。目前基本面因素並不支持英鎊的長期反彈。動量指標仍然處於看跌狀態。
USD/CHF
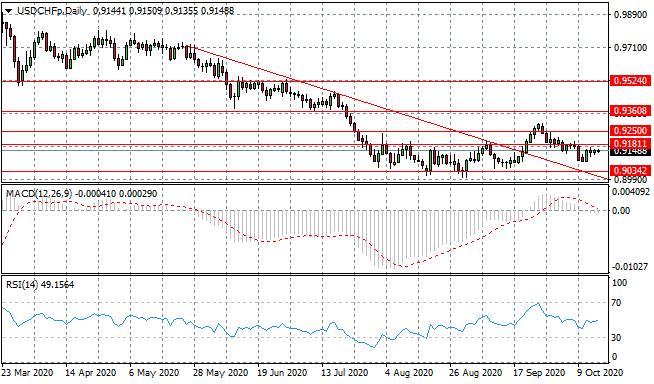
The USD/CHF pair has returned to a previous channel of consolidation between the 0.903 and 0.918 price levels. Despite some rise in buying activity, conviction remains weak. Fundamental factors will lead the way in terms of price direction. Momentum indicators have flattened in neutral/bearish territory.
USD/CHF已回到此前的盤整位置0.903至0.918價格區間。儘管購買行為有所增加,但市場信心依然薄弱。基本面因素將引導價格走勢。動量指標在中立/看跌區域已趨於平緩。
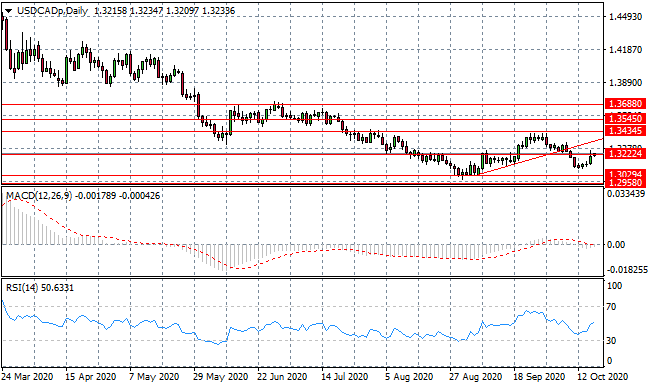
USD/CAD
USD/CAD buyers have returned to take the pair towards the range ceiling at the 1.322 price level. A break would likely take the pair back towards the ascending trendline which formed a support area for the most recent rally. Momentum indicators have begun upward trajectories.
USD/CAD買方已回歸並將貨幣對推向1.322價格區間上限。此次突破可能會將該貨幣對帶回至上升趨勢線,形成近期反彈的支撐區。動量指標已開始向上發展。
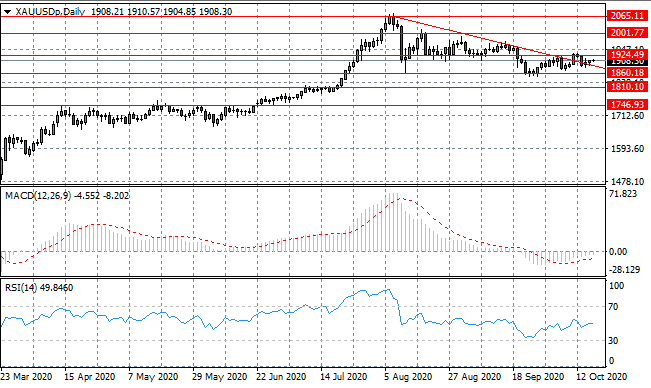
GOLD
Despite some attempts from buyers to re-establish a rally, sentiment remains firmly with sellers as the bearish trend continues. Oscillations towards the 1924.49 resistance level have recently resulted in pullbacks. Momentum indicators have flattened in bearish territory.
儘管買方試圖重新建立反彈,但隨著持續的看跌趨勢,賣方情緒依然堅定。近期回調是由於向1924.49 阻力位震蕩所導致。動量指標在看跌區域趨於平緩。
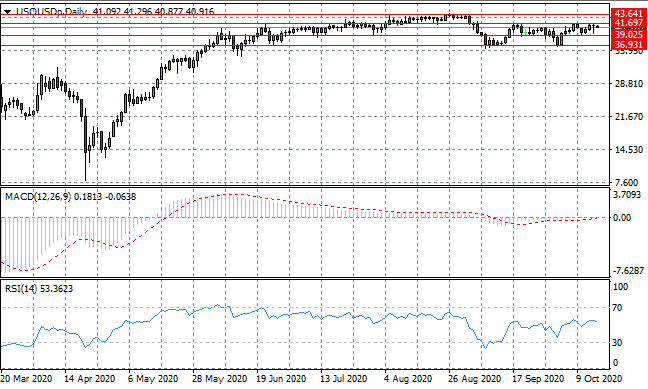
OIL
WTI oscillations continue to narrow with a dragonfly doji occurring mid-range. Typically this signal is bullish when established during a downtrend. However, on this occasion, it simply suggests a continuation of buying pressure. The 41.69 price level still represents a hurdle for the commodity. Momentum indicators are moving into bullish territory.
WTI振蕩繼續收窄並且區間中端出現「蜻蜓十字線」。該信號為看漲信號,通常發生在下跌趨勢中。目前情況下,該信號僅表明持續的買入壓力。41.69價格水平仍然是大宗商品的阻礙。動量指標正進入看漲區域。
In the event of any discrepancies between the Chinese version and English version of the Daily Insights, the latter shall prevail.
以上文章中英文版本若有任何歧義,概以英文版本為準。
This article is to be used only as a reference, not as a basis for trading.
策略僅供參考 不做交易依據