A Shake Up In The Commodities Market
- 25 Nov 2020
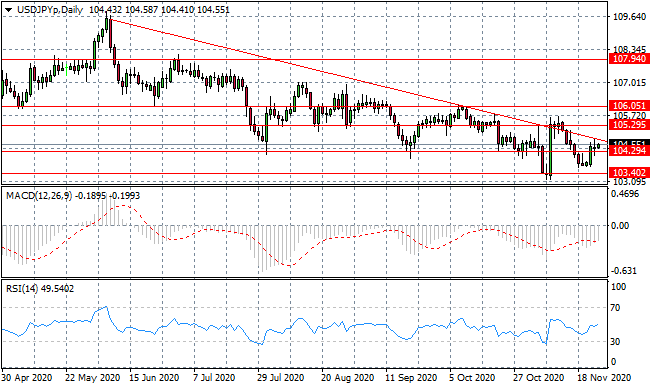
USD/JPY
The USD/JPY pair has once again been contained by the descending trendline where a long-legged doji may signal a trend change, or certainly signifies indecision from market participants. Despite significant buying momentum resulting in a break of the 104.29, gains could be undone in subsequent trading sessions. Momentum indicators have upward trajectories.
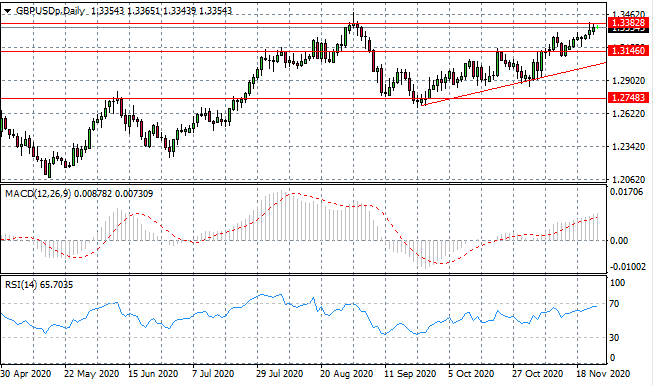
GBP/USD
The GBP/USD pair continues to rally as more buyers are beginning to get behind the move. An acceleration in buying pressure will be required to overcome a key resistance level at the 1.338 price area. Sellers are already making their mark on price action as the pair approaches this key level. Momentum indicators are bullish, yet RSI is approaching overbought conditions.
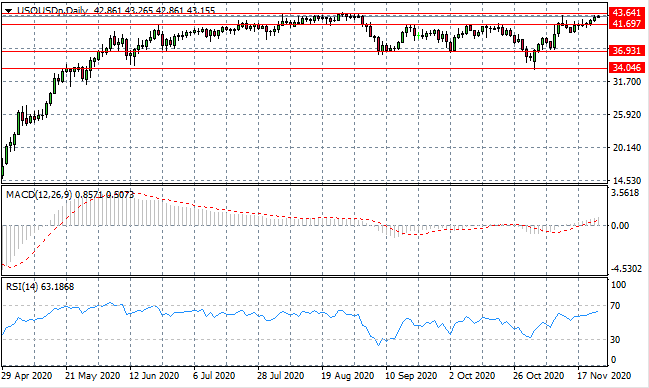
USOUSD
WTI has been unable to break the 43.64 resistance area so far, though this price level has held so many times it has to break. Fundamentals continue to brighten the horizon for the energy sector, however, volatility can be expected as recoveries continue to be asymmetric. Momentum indicators have upward trajectories.
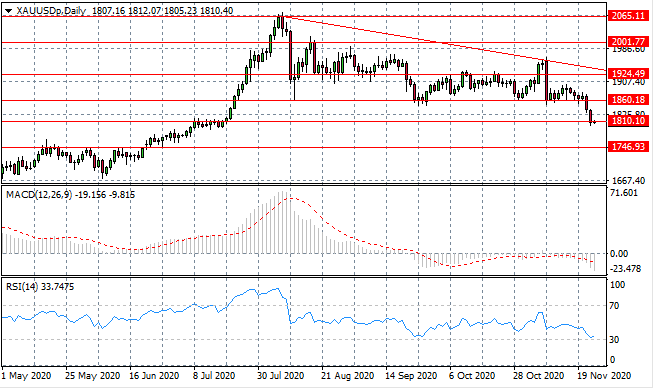
XAUUSD
Gold has broken out of the lower bound of a descending triangle. Strong selling pressure has taken price action towards the 1810.10 support level. There is a chance that the metal will return back towards the 1700 level especially if the current full-scale selling pressure continues. Momentum indicators have downward trajectories with RSI testing oversold conditions.
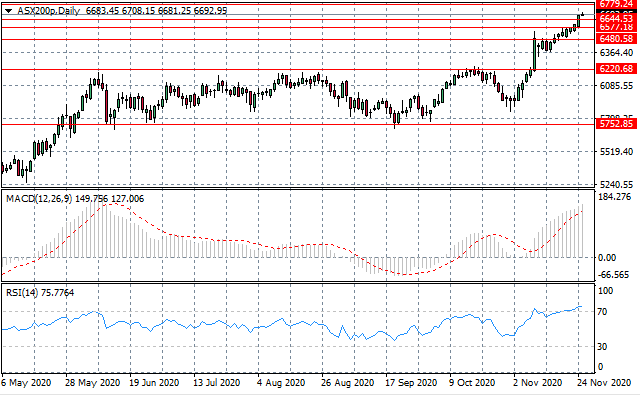
ASX200
The ASX200 has soared passed the 6644.53 resistance level as buyers continue to dominate price action. The next target is the 6780 price level which represents a technical resistance are, at which sellers may decide to return. A clear uptrend has been established after a period of consolidation and a break of the 6220 ceiling. However, momentum indicators are already suggesting that the index is overbought.
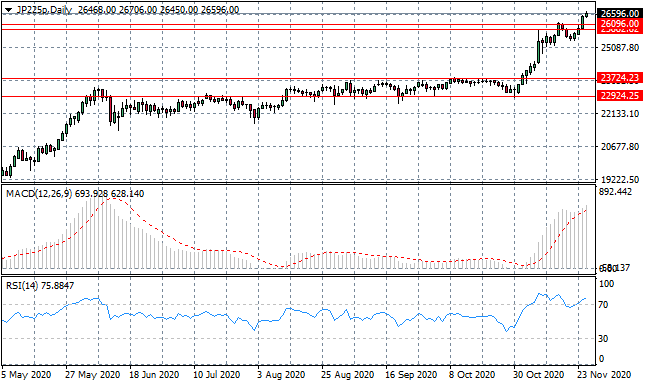
JP225
Yen weakness is reflected in the JP225 index as the rally begins to climb beyond longer-term price highs. Previously, the 26,000 level had held, with a short-term pullback, but the recent break could signify a longer-term bullish trajectory. Momentum indicators are bullish and have moved beyond overbought territory.
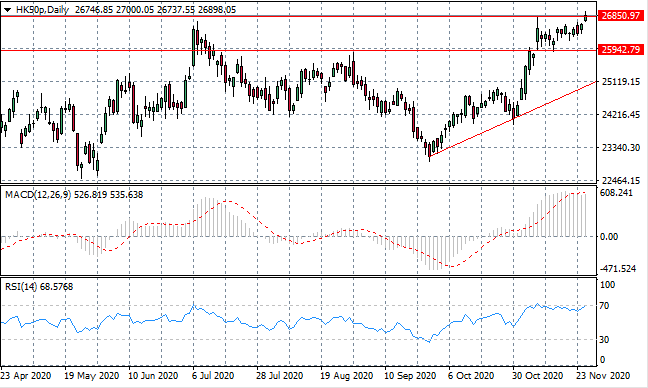
HK50
The HK50 is testing a near-term price high at the 26,850 resistance line. A trend reverse to the negative may be possible given the current rise in selling activity and previous rejections at this price level. Further, momentum indicators are testing overbought conditions and have flattened at their current levels.