Can The ASX200 Hit The 7000 Mark?
- 23 Nov 2020
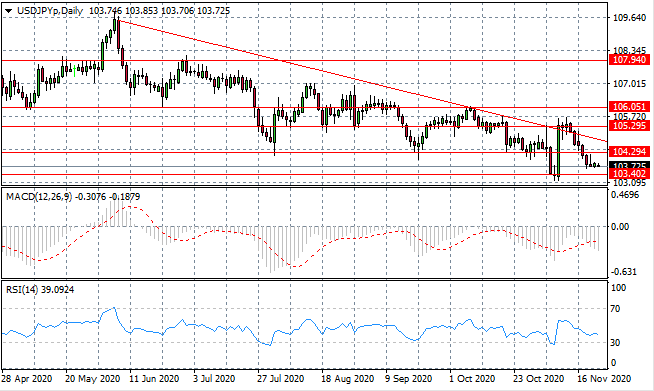
USD/JPY
The USD/JPY pair has stalled after the break of the 104.29 support line, as a series of small-bodied candles indicate that bearish momentum has slowed. There appears to be little appetite from buyers to reverse the long-term trajectory of price action. Momentum indicators remain in bearish territory.
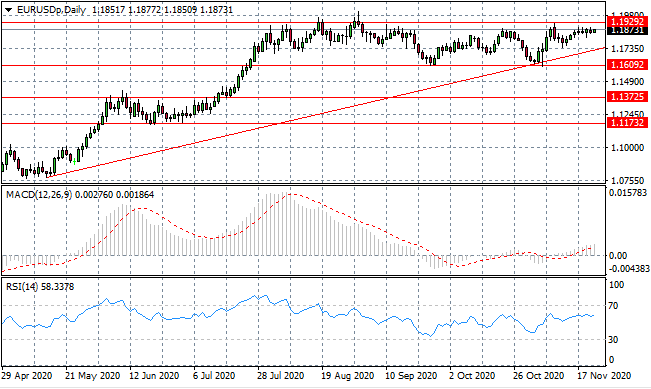
EUR/USD
The Euro has struggled to break out of the current trading range despite a clear bullish bias. Price momentum remains subdued with potential for further upside. Previous attempts to challenge the 1.192 resistance area have resulted in moderate pullbacks. Momentum indicators are moderately bullish.
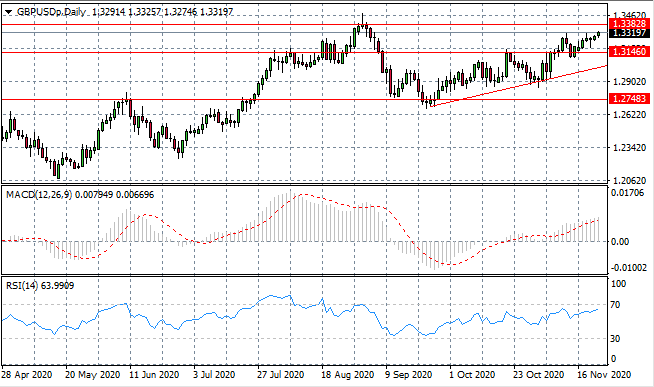
GBP/USD
The GBP/USD pair continues to build on the most recent rally, albeit at a more moderate pace. Another test of the 1.338 resistance area appears to be on the cards. On a previous occasion, when price action reached this level, a reversal followed. Buyers’ conviction will therefore be tested. Momentum indicators are bullish, with further upside potential.
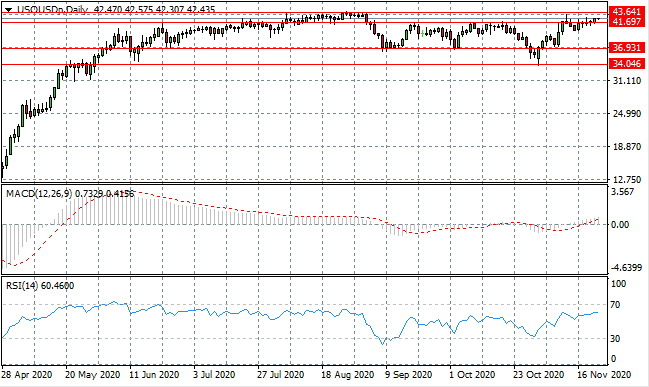
USOUSD
WTI has moved beyond the 41.69 resistance line for the fist time since August. If the commodity can test the 43.64 resistance line, we may expect a significant build in bullish momentum. The more likely scenario, given the current pattern of price action, is a another retracement. Momentum indicators have moderate upward trajectories.
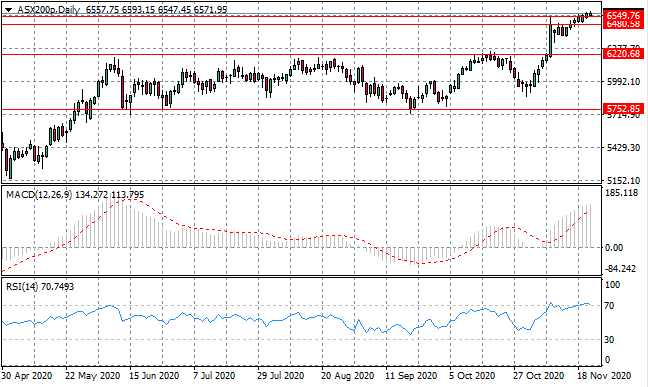
ASX200
The ASX200 is testing the 6549.76 resistance line which is a long-term price high. Momentum has a strong bullish bias, with the last 7 trading sessions being dominated by buyers. A break of the current price range could see the index soar towards the 7000 price level. Momentum indicators are bullish, with RSI testing overbought conditions.
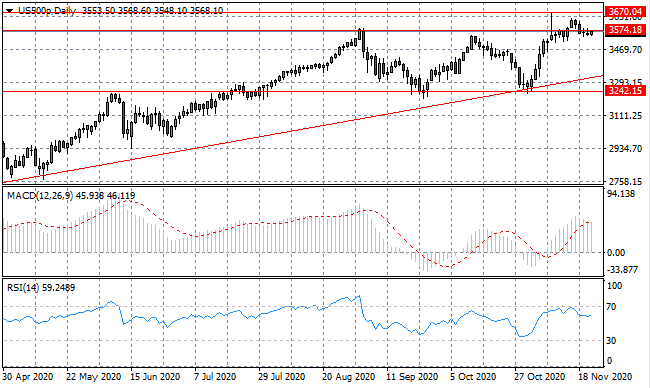
US500
The US500 has pulled back towards the 3574 resistance line, with a series of doji candles collecting at the price level. This area also represents the ceiling of a previous price range, indicating the price action may once again oscillate within these two price levels. Momentum reversals have begun.
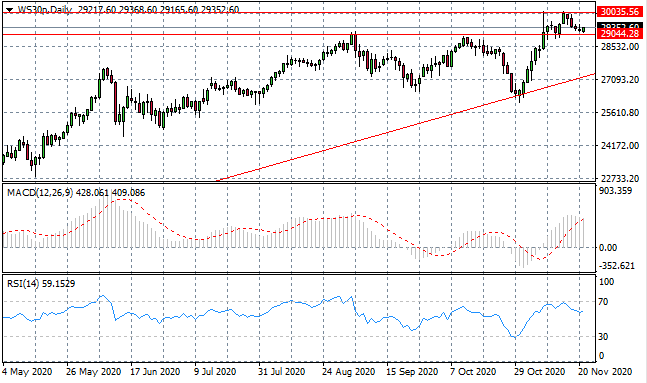
WS30
The WS30 reversal has stalled at the 29,044 price level where buyers have returned. A bounce back from this support area seems likely, given the current lack of conviction from sellers. Whether the current trading range, between the 29,044- 30,035 price levels, remains intact, will be determined in the next few trading sessions. Momentum indicators are also undergoing reversals.