Daily Insights Report 08/08/2017
- 8 Aug 2017
USD/CAD
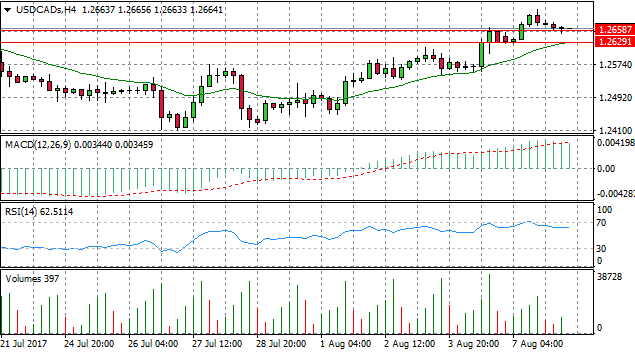
The USD/CAD pair has been in an uptrend since the beginning of August after the Canadian dollar enjoyed dominance over its North American partner in recent months, driven by higher oil prices and a rate hike from the Bank of Canada. In the latest trading sessions, U.S. dollar strength appears to be waning and buyers appear to have reached a point of exhaustion. Volume has dropped off significantly indicating buyers may be closing out positions rather than any real conviction from Canadian dollar buyers. The pair is testing the 1.265 price level which represents a support level after having been a previous resistance level for the pair. If the pair breaks this support level, the next target is the 1.262 price level. MACD and RSI remain flat indicating that momentum is not swayed any particular direction.
GBP/USD
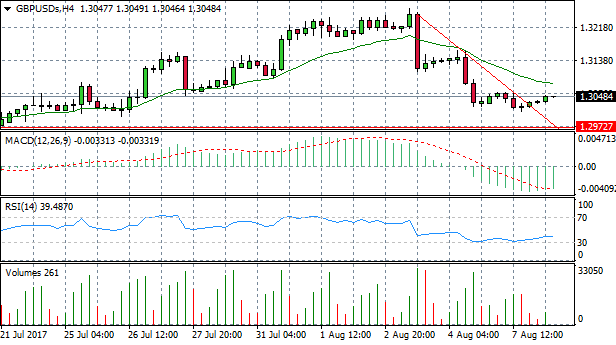
The GBP/USD 4-hour chart shows an interesting development as a clear trend-line has been broken. The pair was trading in a descending flag pattern which has been broken with price action moving above the trend line, albeit at a slow pace. Confirmation of the uptrend will come from a break of the 20-period moving average. Momentum indicators suggest that bullish momentum may be forming as MACD appears to be turning less negative and RSI pulls away from the 30 oversold zone.
GOLD
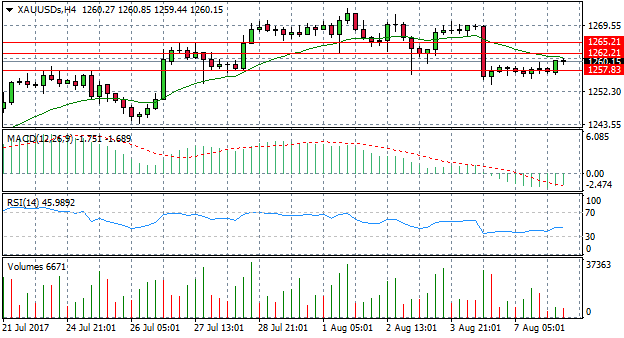
Gold prices have flat-lined since the start of the month, yet a bullish breakout has pushed the asset through the 1257 price level, which had been acting as a resistance line. The question is whether there is enough momentum to push prices higher. The metal is reaching the 20-period exponential moving average (EMA) (green line) and a further resistance line at the 1262 price level. The third price level to resume the previous bullish trend is the 1265 price line. However, volume has dropped off in recent trading sessions; with RSI flattening above the 30 zone and MACD stalling below the zero line. Currently sentiment appears more bearish, suggesting the current bullish move may not be sustained.
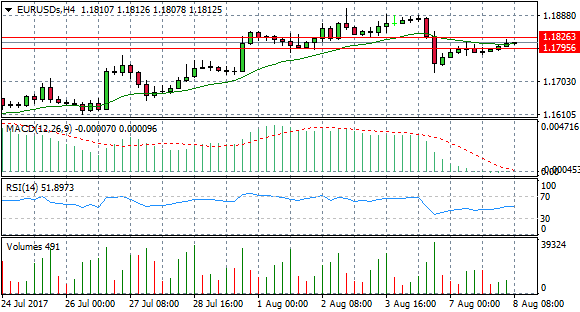
EUR/USD
The most notable indicator on the Eurodollar chart is MACD which has sharply dropped to the zero line, despite prices rising. Other momentum indicators such as RSI remain neutral; flattening along the 50 support level. Price action is testing the 20-period EMA, having broken a previous support level at the 1.17 price level. The next price target for the pair is the 1.18 price level, however price action may struggle to hit this target given the fact that conviction from buyers seems low as highlighted by low volume.