Daily Insights Report 11/07/2017
- 11 Jul 2017
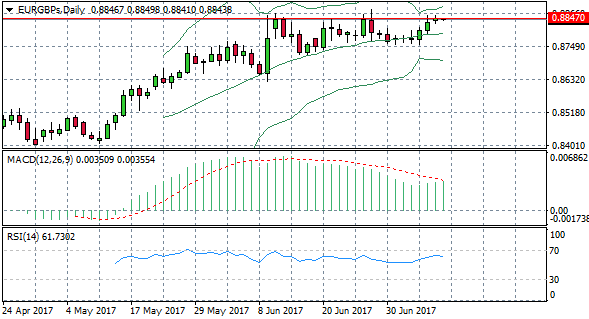
EUR/GBP
The EUR/GBP pair has hit a significant resistance area at the 0.884 price level. Each time the pair has reached this level before, price has bounced back and turned bearish. The pair has also reached the close to the upper Bollinger band and has reached close to overbought territory on RSI. The MACD line is descending despite being above the zero line. A break of the resistance line at 0.884 coupled with MACD turning negative would be required to establish a bearish trend for the pair.
NZD/USD
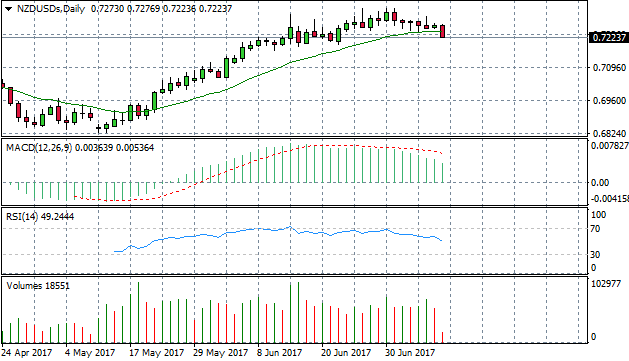
The NZD/USD has broken the 20 period exponential moving average. This is significant as the moving average has been providing a support area for the pair since the indicator was broken on 17th May 2017. After the break, the pair entered into a sustained uptrend with 20 bullish trading sessions out of 36 trading sessions. Volume has risen into the bearish move indicating increasing appetite from sellers or at least, an increase in selling activity. Both MACD and RSI have downward trajectories.
Impact event: The JOLTS employment report at 17:00 GMT+3. Several Federal Reserve members are speaking between 19:30 GMT+3 and 20:20 GMT+3 which could impact dollar pairs.
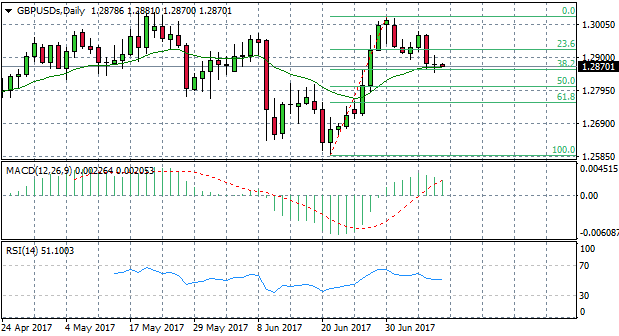
GBP/USD
After a strong bullish run the GBP/USD pair has retraced back to a significant support level at the 38.2 Fibo level. The extent of the retracement will be determined by the pair’s ability to break this support level. Price action has hit and also found support at the 20- period exponential moving average. Momentum indicators do not appear to support either directional move. MACD is in positive territory above the zero line and RSI is flat at the 50 support level. A doji candle in the previous session also suggests indecision in the market. Generally, Fibonacci levels indicate (in this example) areas where a possible bullish reversal may take place. However, given fundamental factors are there enough buyers for the British Pound?
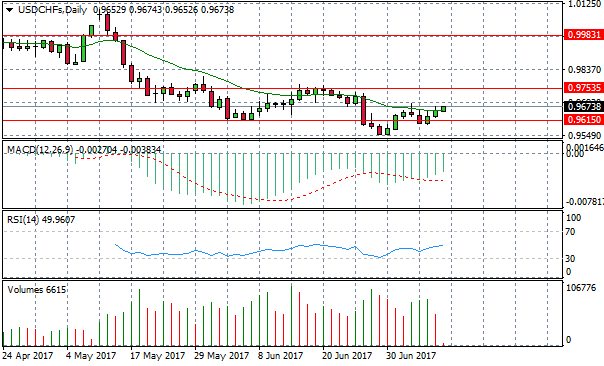
USD/CHF
The USD/CHF pair has broken a recent support level at the 0.961 price level. Additionally, and more significantly, price action has broken the 20-period exponential moving average. If the current candle can close above the 20-period EMA, the next price target for will be the 0.975 price level. Price action has remained within this tight trading range since mid-May and each time the price has broken the 20-period EMA the following candle has been bearish. Momentum indicators suggest that sentiment is becoming slightly less bearish, however, there does not appear to be an real conviction from buyers.