Eurodollar Tests Key Resistance Zone
- 29 Oct 2021
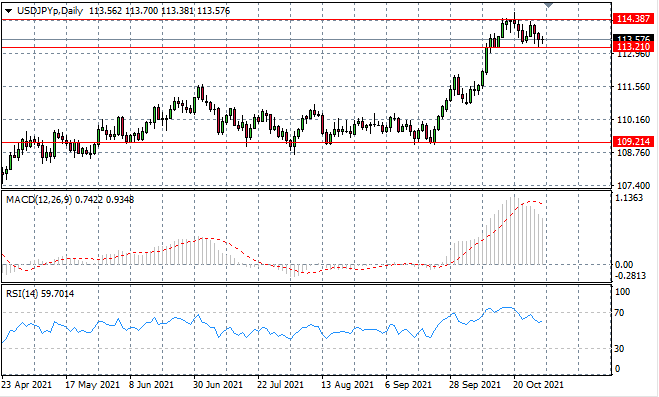
USD/JPY
The USDJPY pair looks set to continue oscillating within the 113.21 and 114.38 price levels as the range has contained price action in recent trading. Buying pressure spiked in the last two trading sessions when the pair approached the support line. Momentum indicators have turned bearish.
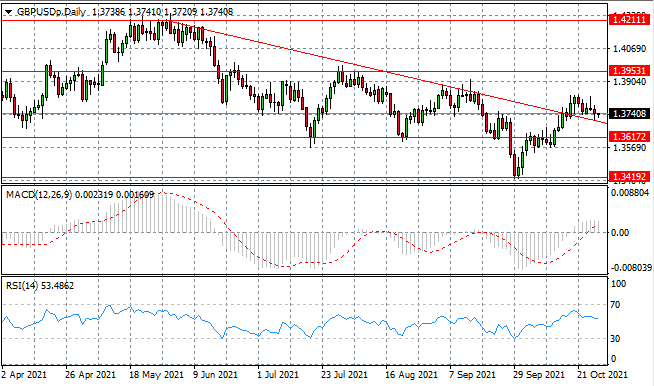
GBP/USD
The GBPUSD pair continues to float lower, with a moderate bearish bias. A break has yet to materialise indicating that that bearish conviction remains low. Doji candles indicate indecision and the current trajectory will likely continue until there is a material change in fundamentals.
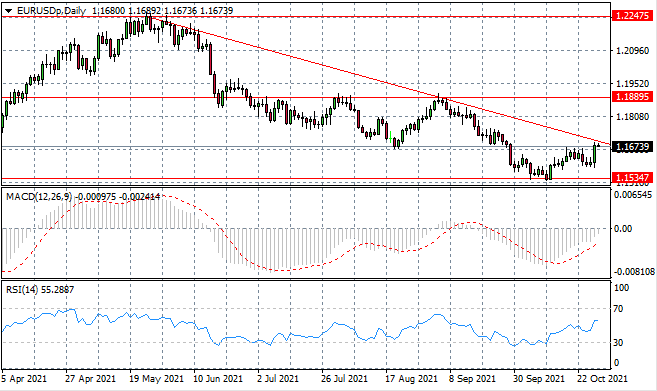
EURUSD
The EURUSD buyers returned with strength in yesterday’s trading as the session was dominated with bullish momentum. The pair has reached an obstacle in the descending trendline. The question is whether bullish momentum is sufficient to drive a break. Momentum indicators have sharp upward trajectories.
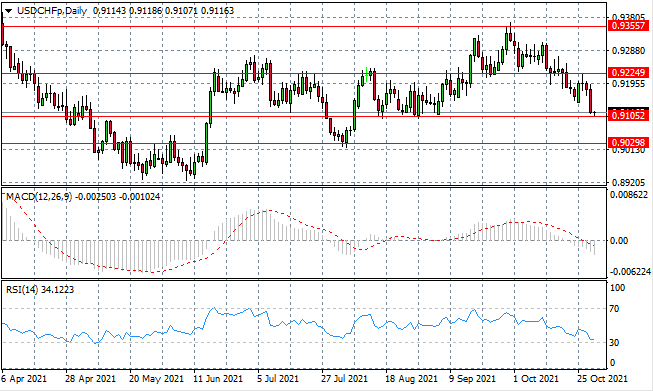
USDCHF
The USDCHF has plummeted back to the 0.910 support level, where price action appears to have stalled. The support line has proven to be an obstacle on several previous occasions. Momentum indicators suggest that the pair is oversold with RSI touching the 30 zone.
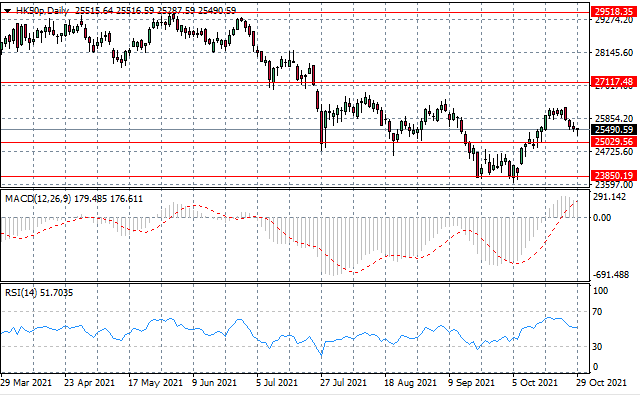
HK50
HK50 is reaching lower highs and confirming the longer-term bearish trend. Despite a period of consolidation in the last 6 months and several attempted rallies, sentiment remains bearish. The index is therefore, returning to the lower bound of the current consolidation channel at the 25,029 support level.
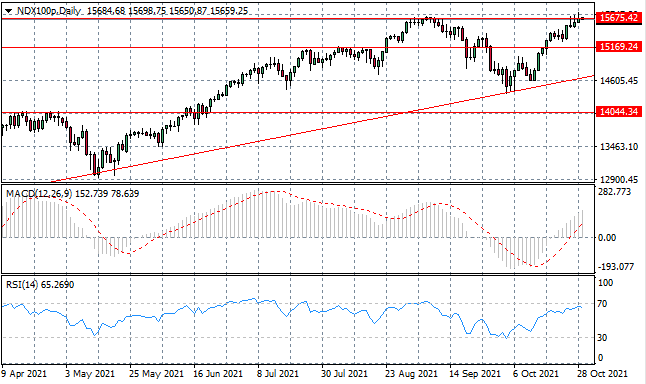
NDX100
The NDX100 has tested the 15,675 resistance line for a number of the last trading sessions and a break has not et occurred, not least, because of the rise in selling pressure. Momentum indicators highlight that the pair is overbought and a reversal of the current rally may be on the cards.
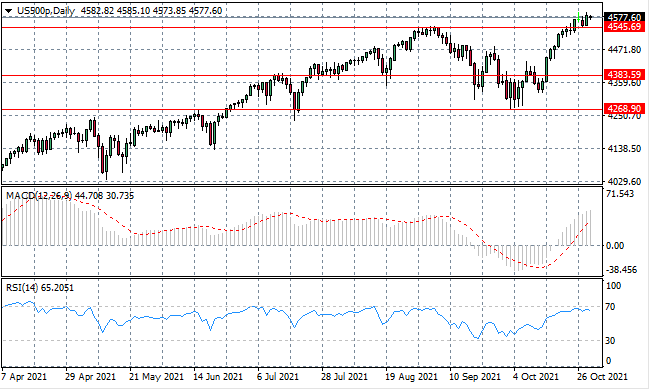
US500
The US500 has rebounded from the 4545 price line, as buyers still appear to have conviction in the rally. By contrast, momentum indicators have flattened just below the overbought line which is typically a signal that the rally won’t last.