Further Downside For The USDCAD?
- 11 Jun 2020
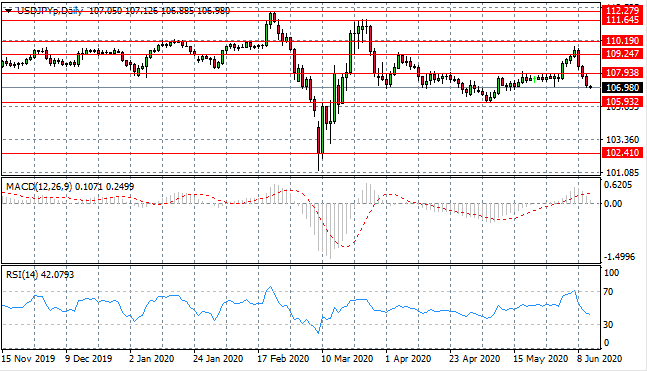
USD/JPY
The USD/JPY pair has dropped below the 107.93 support level, as sellers return to drive price action back towards the 105.93 price line and a previous trading range. Momentum indicators reflect bearish sentiment with downward trajectories.
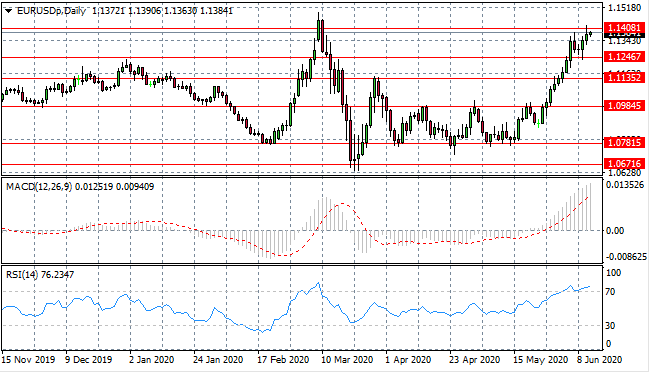
EUR/USD
Eurodollar buyers have returned to make another attempt at the 1.140 resistance line and a break attempt was not sustained. The pair is approaching a recent price high and near-term direction will be determined by buyers’ appetite. Momentum indicators remain bullish and RSI has moved beyond the overbought ’70’ line.
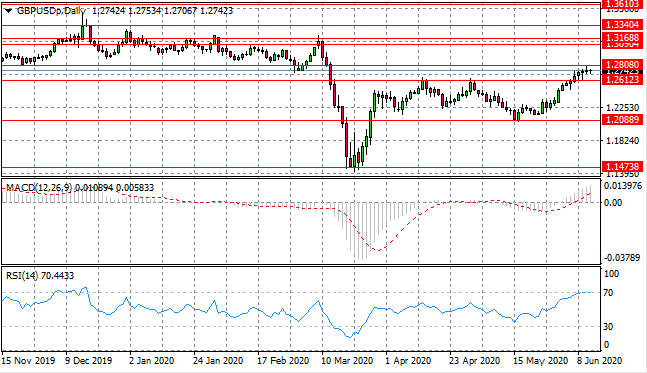
GBP/USD
The GBP/USD pair has finally broken the 1.261 resistance level and is heading towards the 1.280 price level which represents the floor of a previous trading range. Momentum indicators remain in bullish territory and RSI is testing the overbought resistance line at 70.
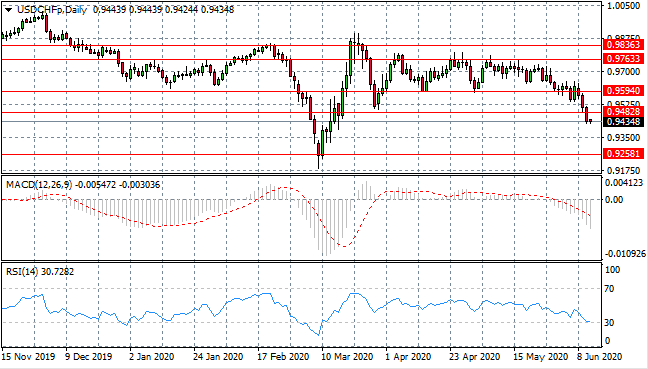
USD/CHF
The USD/CHF pair has broken the 0.948 support level as the Dollar continues to come under pressure. A support level exists at the 0.925 price line representing the start of the covid outbreak. Momentum indicators have turned bearish with RSI testing oversold conditions.
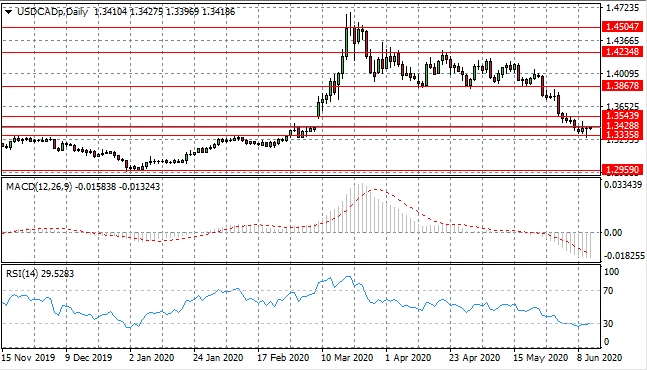
USD/CAD
The USD/CAD sellers have taken price action towards the 1.333 price level where a stall has occurred. Buying pressure is rising although lacks conviction. A gap in previous trading has been filled and is generally a continuation signal. There is potential for further downside. Momentum indicators remain bearish yet RSI is testing the 30 oversold line.
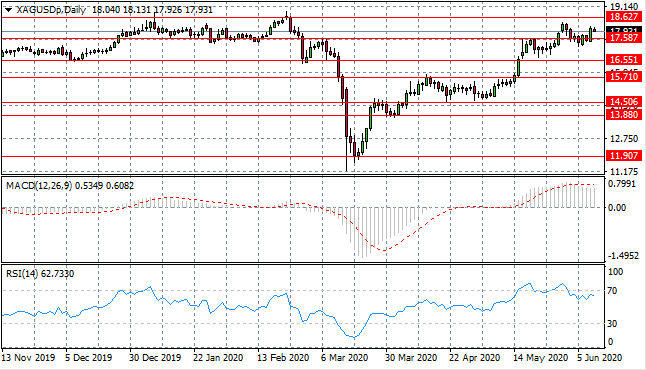
SILVER
Silver has returned to the 17.58 price line and buyers have led the rise in price action with conviction, the question is whether the break can be sustained. The next target is the 18.62 price level which represent a recent ceiling. Momentum indicators appear to be undergoing reversals.
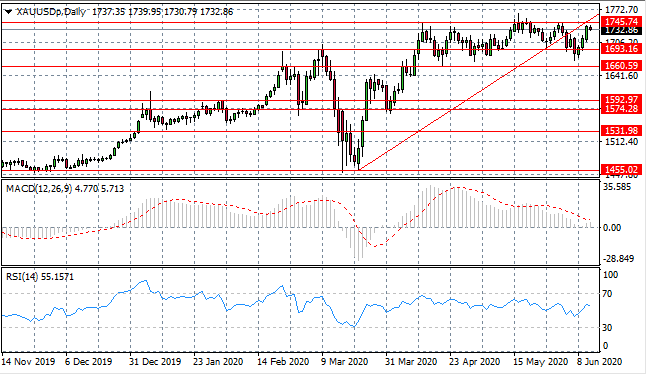
GOLD
Gold buyers have returned to take the metal back towards the 1745.74 resistance line and the ascending trendline. In recent trading the metal has been unable to move beyond this resistance area. Momentum indicators have stalled in bullish territory.
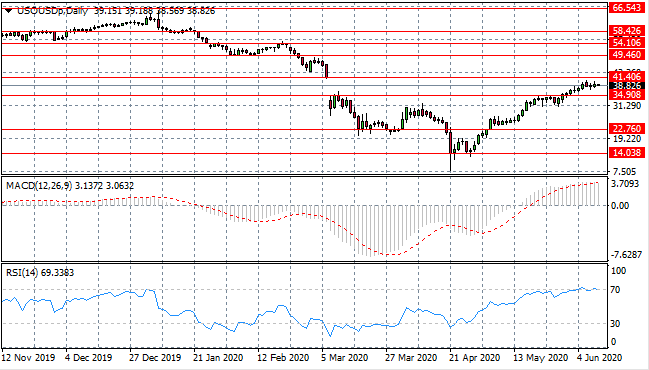
OIL
WTI has finally broken the 34.90 resistance level, which is significant as it represents a gap fill line from the previous downtrend. Yet, once again, price action has stalled before truly testing the 41.40 resistance line. Momentum indicators remain in bullish territory although RSI suggests oil is overbought.