HK50 Tests Key Support Level
- 7 Jul 2021
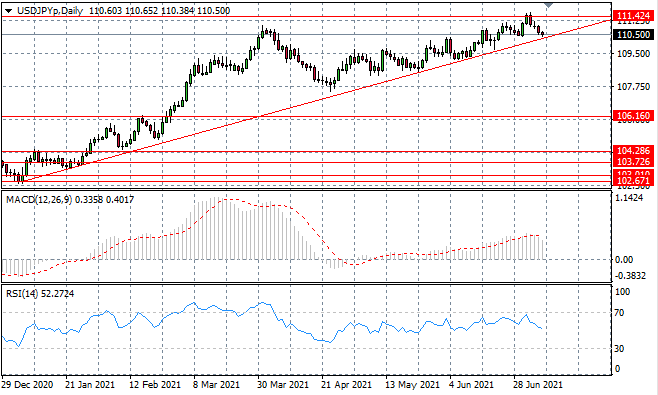
USD/JPY
The USDJPY pair is testing the ascending trendline and therefore we may expect the return of buyers and a subsequent rebound. The next oscillation will take the pair closer to the apex of an ascending triangle- a bullish continuation pattern. Momentum indicators have downward trajectories.
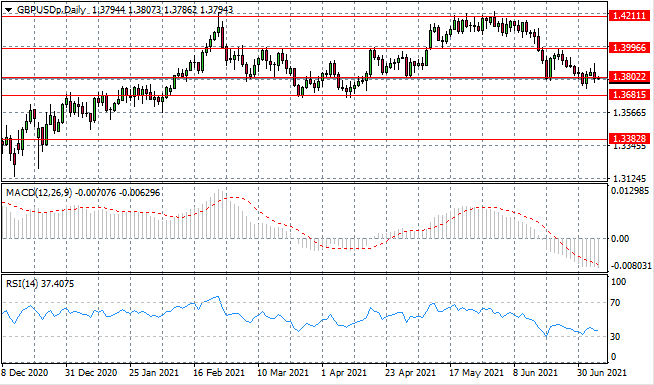
GBP/USD
The GBPUSD pair has returned to the 1.380 support level which represents the lower bound of a previous trading range. A break would see price action return to pre-recovery prices and suggest that longer-term sentiment has turned bearish. Momentum indicators have flattened in bearish territory.
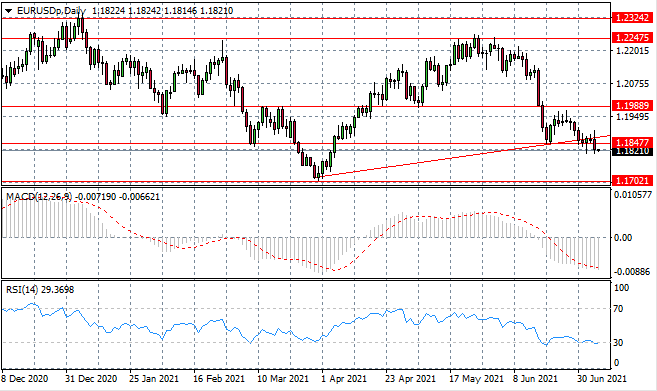
EURUSD
The Eurodollar has broken the 1.184 support level as well as the ascending trendline. The return towards recent price lows suggest considerable bearish sentiment has overcome the pair. Another support level exists at the 1.170 price line. Momentum indicators are testing oversold conditions.
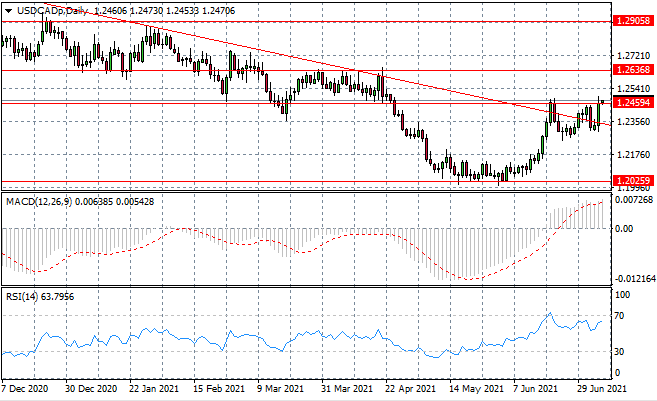
USDCAD
The USDCAD has made a recovery and price action is now testing the 1.245 price area. This resistance zone represents the lower bound of a previous trading range before the most recent sell-off. Bullish conviction will be tested. Momentum indicators remain bullish.
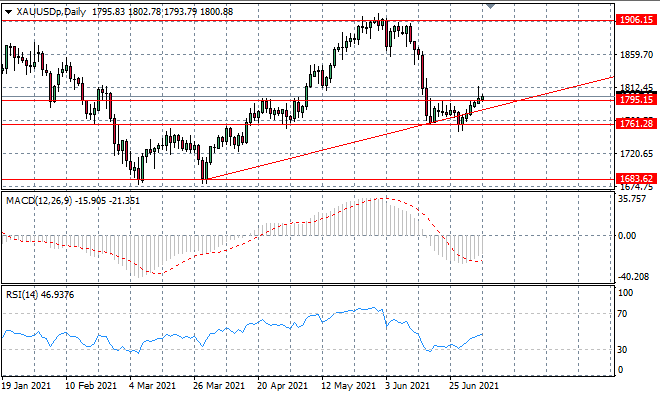
XAUUSD
XAUUSD appears to the lack the support to drive a rally. Selling pressure has begun rising around the 1795 resistance line, indicating that bullish momentum may be waning. Momentum indicators have sharp upward trajectories.
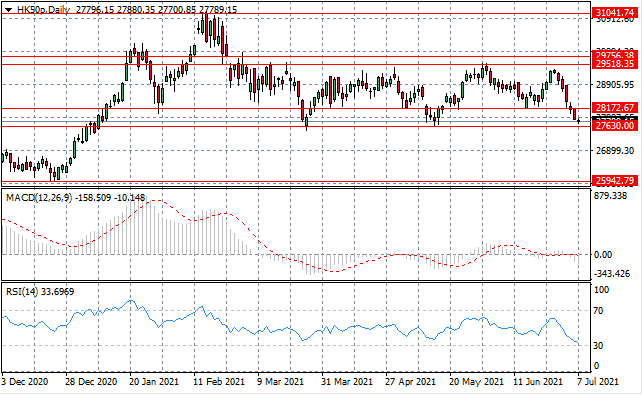
HK50
The HK50 has broken the 28,172 price line and is now moving towards the 27,630 support level. Typically, bullish rebounds take place at this price level and therefore we may expect the return of buyers. Momentum indicators have downward trajectories, with RSI testing the oversold line.
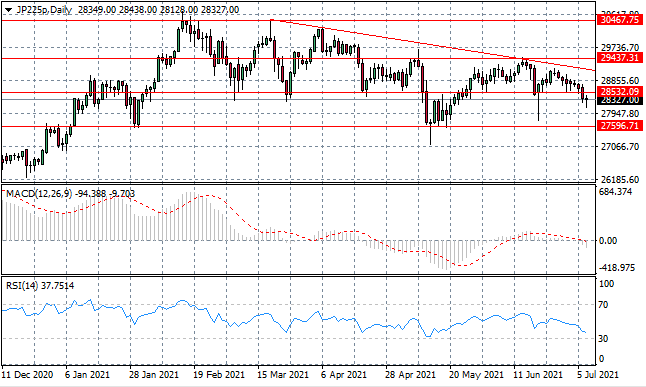
JP225
The JP225 index has broken the 28,532 support level as bearish sentiment continues to drive the pair lower. A stall has taken place in early trading, where buying pressure has started to rise. Momentum indicators have downward trajectories with MACD breaking the zero line.