How Much Lower Will Oil Prices Go?
- 27 Feb 2020
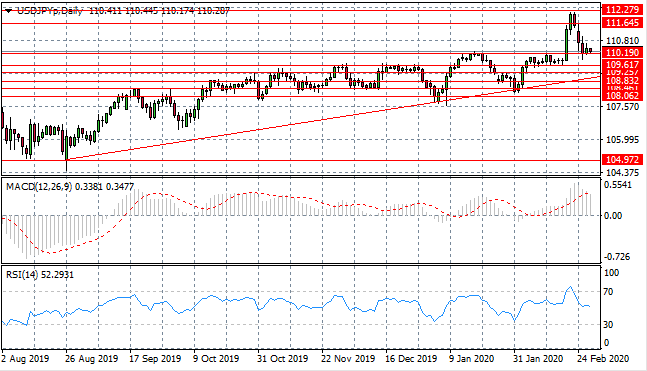
USD/JPY
The USD/JPY sell-off has taken price action back towards the 110.19 support level which represents a previous resistance area. A break would be significant for the pair as it would mean reentering a previous trading range. The question is whether the uptrend will continue, perhaps at a more moderate pace. Momentum indicators have downward trajectories.
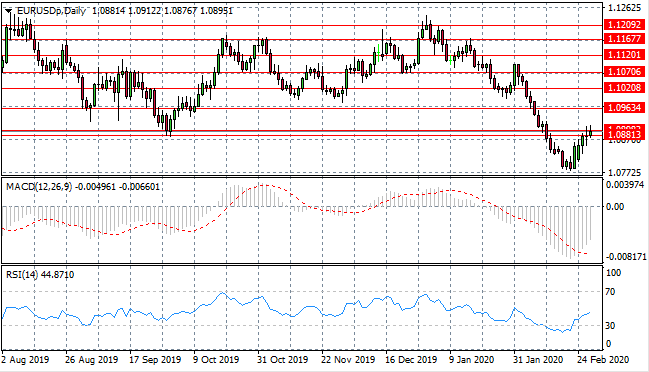
EUR/USD
The Eurodollar recovery is underway with price action testing the 1.089 resistance line, which represents a longer term support level. Selling pressure remains albeit with less conviction than before. A break into the previous trading range would confirm the reversal. Momentum indicators support bullish sentiment with upward trajectories.
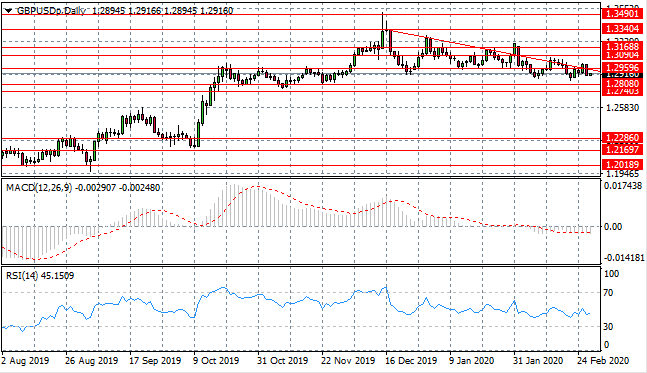
GBP/USD
The GBP/USD pair continues to oscillate around the descending trendline with breaks lacking the momentum to move price action in either direction. Considering the fact that oscillations are narrowing, a break seems imminent. Momentum indicators have flattened in neutral/bearish territory.
USD/CHF
The USD/CHF pair has moved to test the 0.973 support level as a longer term downtrend begins to form. Although the pair has stalled above this support level, sellers remain active which indicates further downside potential. Therefore, the next target is the 0.971 price line. Momentum indicators have downward trajectories.

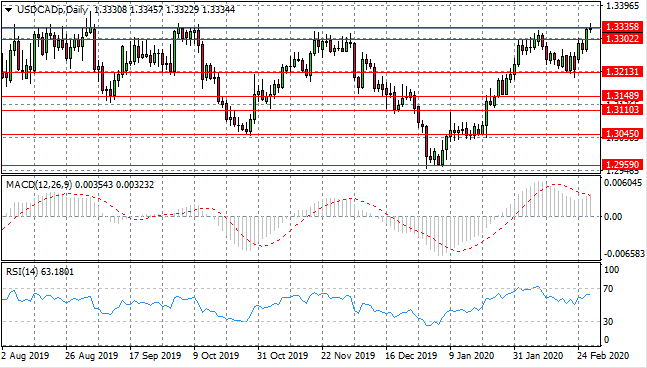
USD/CAD
USD/CAD volatility continues as the petrocurrency is influenced by geopolitical events relating to oil prices. On this occasion, the pair has pushed beyond the 1.330 hurdle and is now testing the 1.333 resistance level which represents a recent ceiling. Clearly, a bullish break would be significant. Momentum indicators suggest there is further upside with RSI yet to test the overbought line.
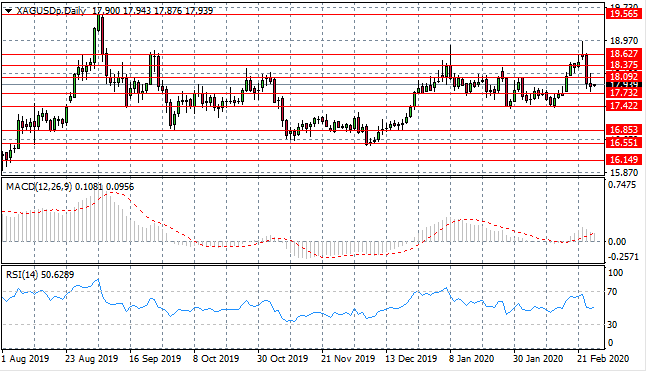
SILVER
Silver’s reversal has stalled after price action broke the 18.09 price level. The break was followed by a doji candle indicating a tussle between buyers and sellers. In the most recent trading range, a floor exists at the 17.42 support line. Currently, sellers appear to have lost steam. Momentum indicators have moderate downward trajectories.
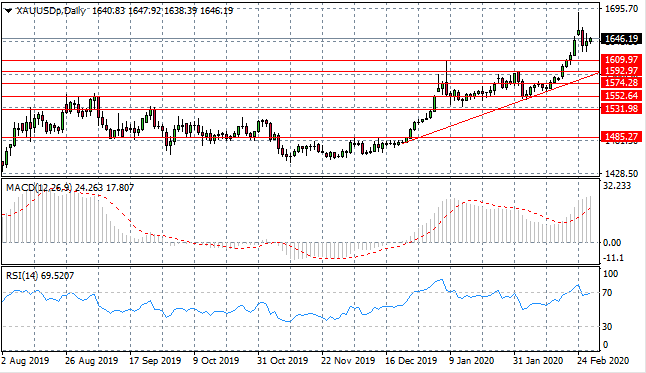
GOLD
Gold buyers have returned after losing the edge in previous trading. It appears likely that commodity will remain in the 1600 range, however, the question is whether buyers have the appetite to test the 1700 range. Momentum indicators remain in bullish territory, however RSI has flattened at the 70 resistance area.
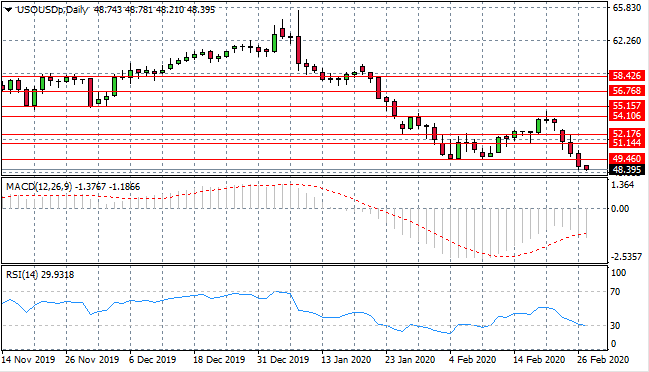
OIL
WTI sellers have returned to push bearish sentiment in the last three trading sessions and, as such, WTI is now testing the $48 per barrel range. Will sentiment continue to worsen? Judging by early trading in today’s session, sellers are dominating once again. Momentum indicators remain in bearish territory, with RSI testing oversold conditions.