Is A Bullish Run Forming For GBP/USD Pair?
- 7 Jul 2020
USD/JPY
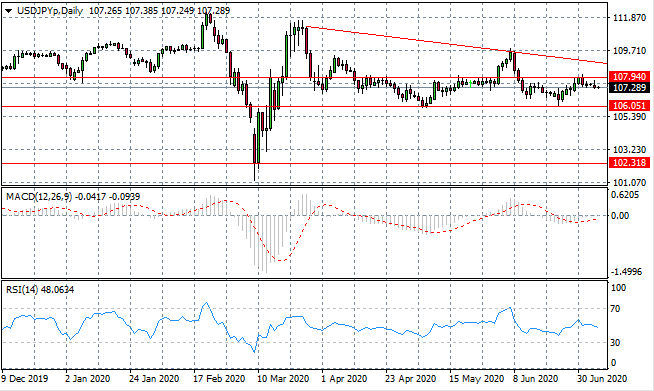
The USD/JPY pair has oscillated between the 106.51 and 107.94 price levels in recent trading and the pair is pulling away from the 107.94 resistance level, once again. It appears that the trading range is likely to remain intact, especially with a longer-term downtrend established. Momentum indicators remain in bearish territory.
EUR/USD
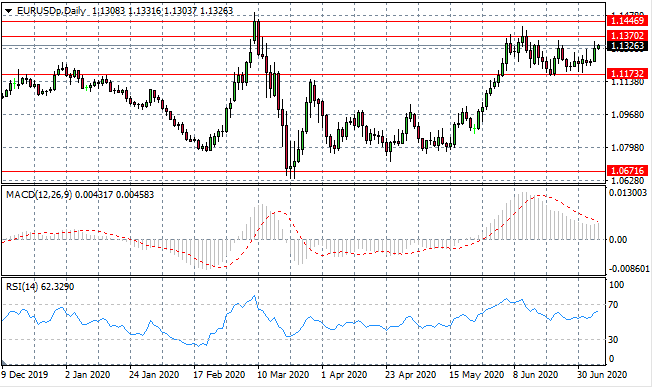
Eurodollar buyers have returned and the question is whether the pair can drive a break at the 1.137 resistance line. A breakout of sorts is underway after price action narrowed in recent trading. Momentum indicators remain in bullish territory with RSI approaching overbought conditions.
GBP/USD
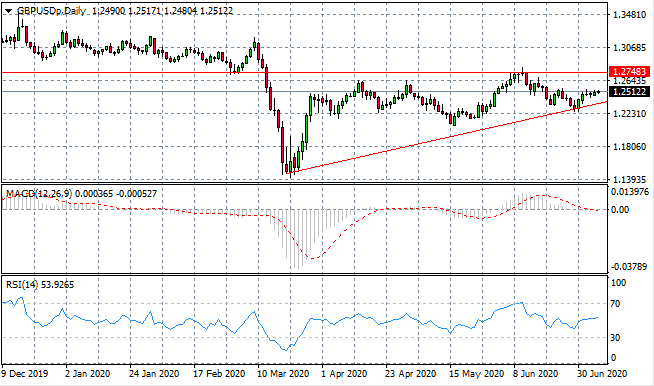
The GBP/USD pair has rebounded from the ascending trendline, as price action forms an ascending triangle pattern. A breakout is more likely the closer to the apex and current moves suggest waning conviction from buyers. Momentum indicators have flattened in neutral territory.
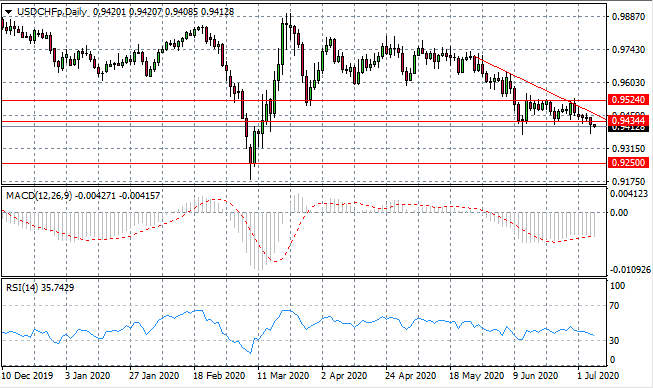
USD/CHF
The USD/CHF pair has broken a key support level at the 0.943 price level, where previously, sellers had been held. A descending triangle pattern indicates that there will be a continuation of the bearish moves in line with a longer-term downtrend. Momentum indicators have flattened in bearish territory, with RSI approaching the 30 support line.
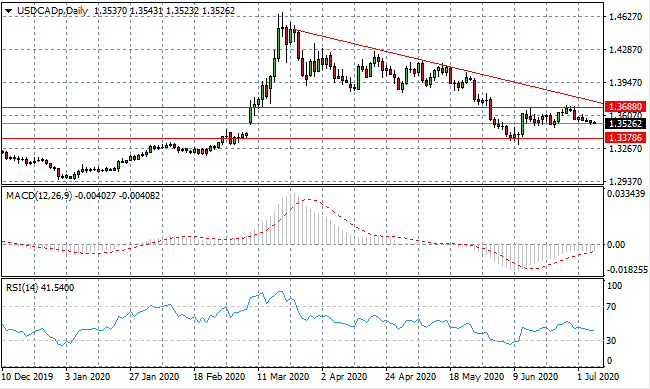
USD/CAD
The USD/CAD rejected the 1.368 resistance line to reestablish the downtrend and take price action back to the 1.337 support level. Momentum indicators are mixed; with RSI approaching oversold conditions and MACD forming a bullish trajectory.
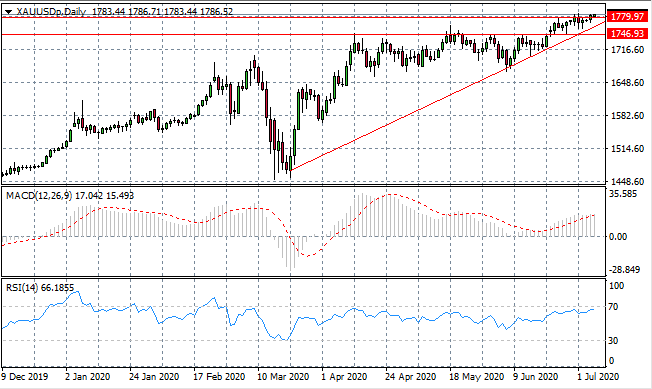
GOLD
Gold continues to hug the ascending trendline as it continues its upward trajectory, moving passed a series of resistance levels. Buying pressure remains despite some slow progress in recent trading. Momentum indicators remain in bullish territory with RSI flattening just below the 70 resistance level.
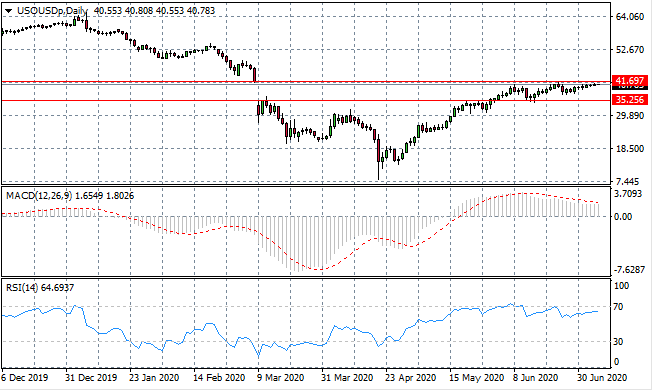
OIL
WTI appears to be making another attempt at the 41.69 resistance line despite scant conviction from buyers. The resistance represents the ‘gap-fill’ line which particularly significant as it represents a complete price recovery to a trading range established before the Covid-19 sell-off. Momentum indicators have flattened in bullish territory.