Daily Insights Report 26/05/17
- 26 May 2017
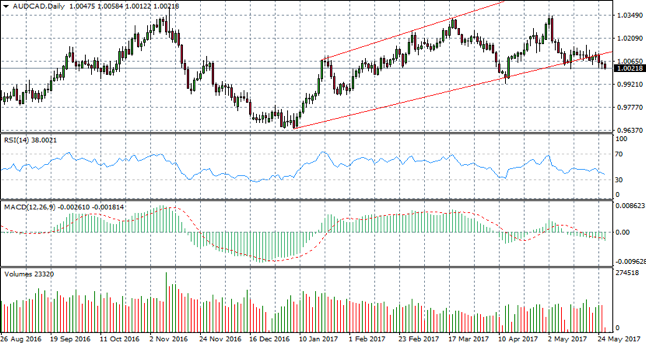
AUD/CAD
After a significant uptrend, the AUD/CAD pair appears to be sustaining a break of the trend line/support level. Both RSI have downward trajectories and MACD also indicates that momentum is bearish with a sustained break of the zero line. The volume indicator suggests interest/trading in the pair remains high.
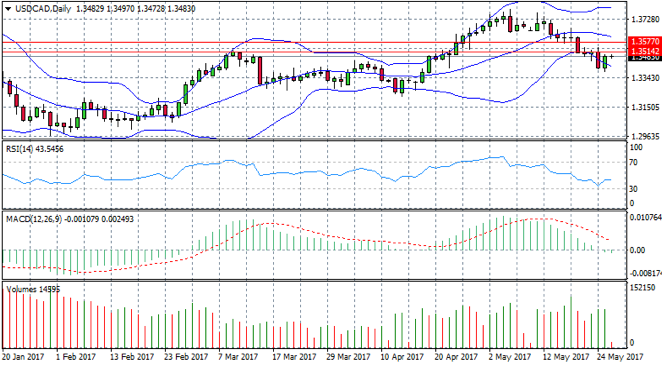
USD/CAD
The USD/CAD has broken lower Bollinger band and price action has bounced upwards. RSI confirms that momentum has moved off an oversold position. Volume is rising which suggests the trend is gathering steam; however, the uptrend will be confirmed if price action breaks the resistance level at 1.351.
Impact event: Prelim U.S. GDP figures released at 15:30 GMT+3. A marginal rise in growth is expected.
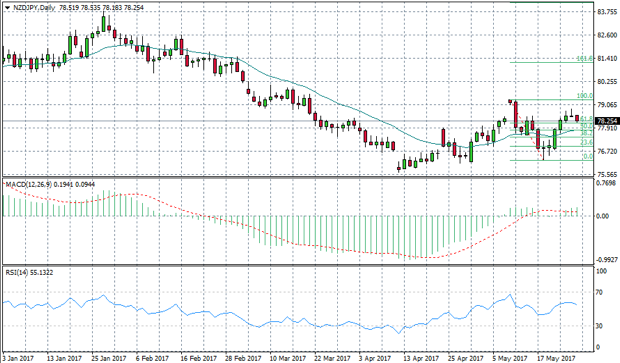
NZD/JPY
The NZD/JPY pair has retraced back from a short-term downtrend. Price action has hit the 61.8 Fibo level which may signal a bearish reversal. A shooting star candle formation at the top of the trend further signals a potential bearish reversal. Selling pressure is indicated by the long lower shadow in the last candlesticks/trading sessions.
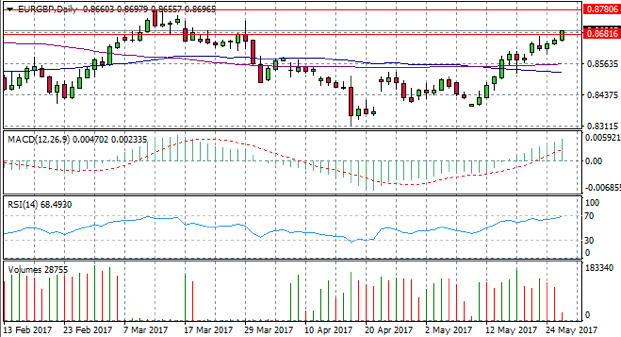
EUR/GBP
The EUR/GBP pair appears to be approaching overbought territory; however, the pair has broken the resistance line at 0.868. The next price target for the pair would be 0.878, if the current bullish move is sustained. However, there is a bearish crossover of the 50-day moving average over the 100-day moving average and RSI has hit the 70 resistance zone. Volume appears to be declining so the question is: for how long can the move be sustained?