Daily Insights Report 30/06/17
- 30 Jun 2017
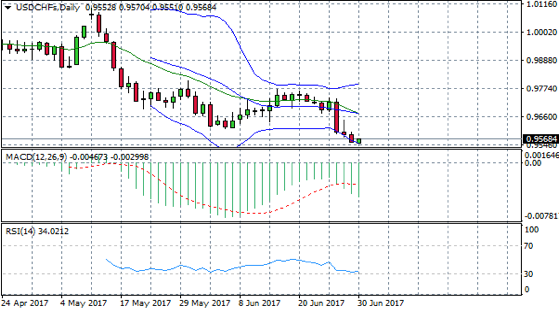
USD/CHF
The USD/CHF has broken the lower Bollinger band on three consecutive occasions followed by a bullish candle in the current trading session. RSI has also bounced off the 30 support line and if the current bullish candle closes above the 30 support line on RSI, a reversal is indicated. The MACD line has flattened however the histogram indicates bearish momentum.
Impact event: U.S. Personal Consumption Expenditure is the Federal Reserve’s favoured metric for measuring consumer spending. Data will be released at 15:30 GMT+3.
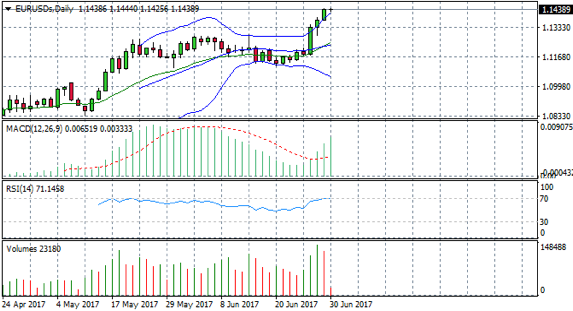
EUR/USD
The EUR/USD pair has reached a statistical extreme with several breaks of the upper Bollinger band. RSI has flattened at the 70 resistance level. Both indicators suggest the asset is oversold and there is potential for a reversal. Volume has also dropped off the pace indicating buyers may be losing the stamina required to push prices higher. The reversal is indicated by a bearish candle breaking closing below the 70 resistance level.
Impact event: Eurozone CPI data, which is expected to fall marginally, is due to be released at 12:00 GMT+3.
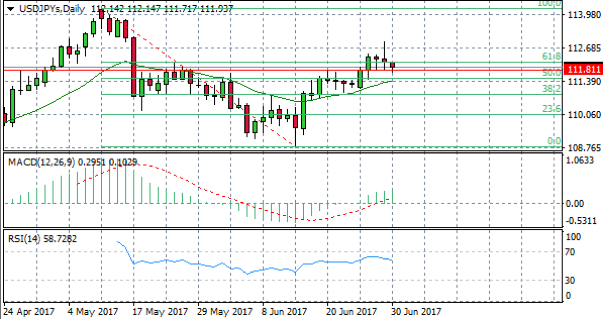
USD/JPY
The USD/JPY pair has broken below the 61.8 Fibo level indicating that a bearish reversal is underway. Confirmation of the reversal will result from a break of the next support level at 111.81 and the 20-period exponential moving average. RSI has a downward trajectory and the MACD line has flattened.
Impact event: U.S. Core PCE data will be released at 15:30 GMT+3 and will effect all dollar pairs.
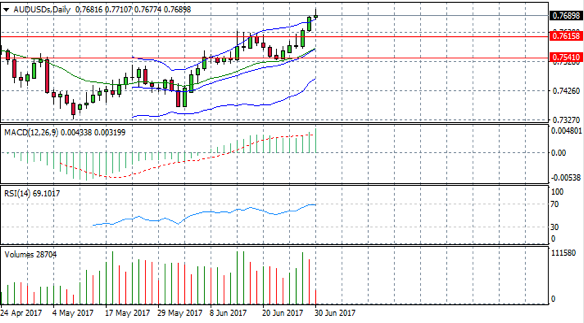
AUD/USD
The AUD/USD pair has broken the upper Bollinger band in the current trading session with what appears to be significant selling pressure (indicated by long upper shadow). RSI has also hit the 70 resistance line indicating that the asset is currently oversold. MACD appears to be flattening and volume has dropped off suggesting that buyers are losing steam.