USOUSD Rally Marches On
- 22 Jun 2021
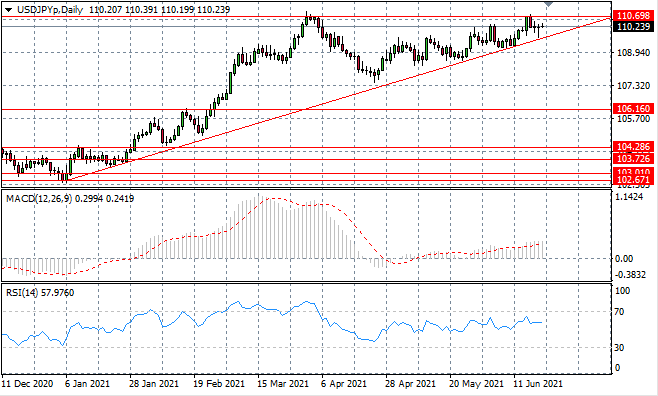
USD/JPY
USDJPY continues to oscillate within the pattern of an ascending triangle where typically, a bullish breakout can be anticipated. Another attempt at the 110.69 resistance line seems inevitable, however, bullish conviction currently remains low. Momentum indicators are bullish with upward trajectories.
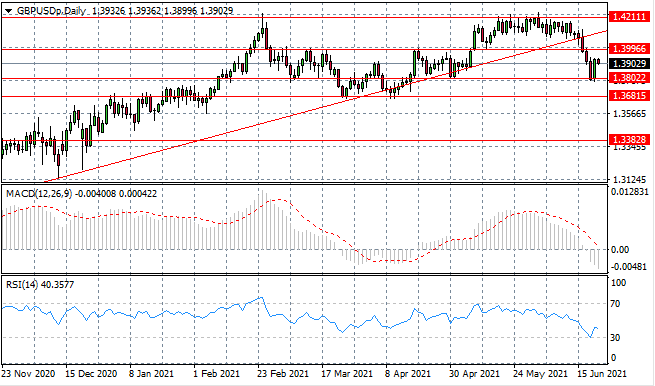
GBP/USD
The GBPUSD pair has rebounded from the 1.380 support level as buyers have returned with strength in yesterday’s trading. Sellers are still active, however, which suggest that the pair may consolidate within the current range in the near-term. Momentum indicators are undergoing bullish reversals.
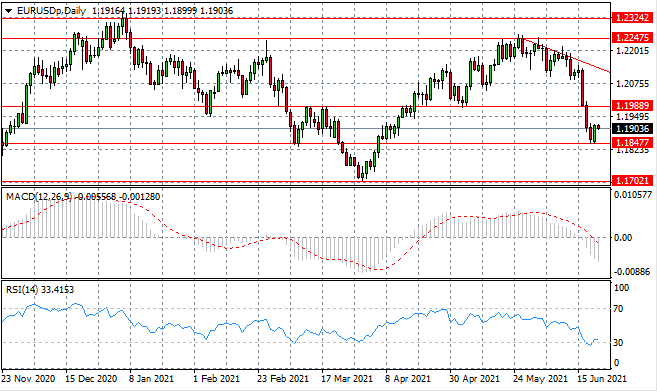
EURUSD
The Eurodollar may consolidate for a period of time within a transitory trading range between the 1.184 and 1.198 price levels. Sellers appear active in early trading after a rally attempt was made in yesterday’s session. Momentum indicators suggest a bullish reversal is underway.
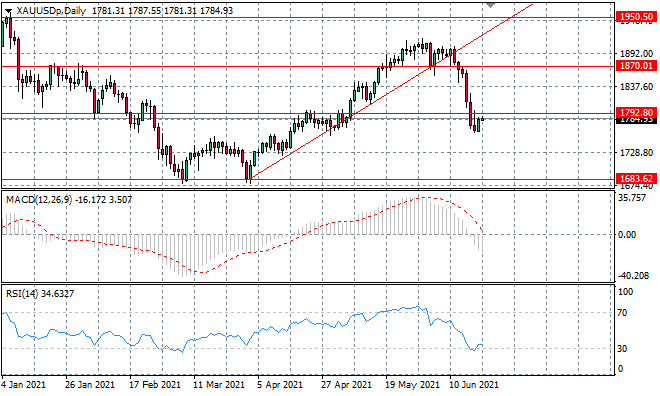
XAUUSD
Buyers are beginning to return to XAUUSD after a significant sell-off which reversed most of the gains made by the most recent rally. The next obstacle for buyers is the 1792 resistance line. Momentum indicators suggest the metal is oversold.
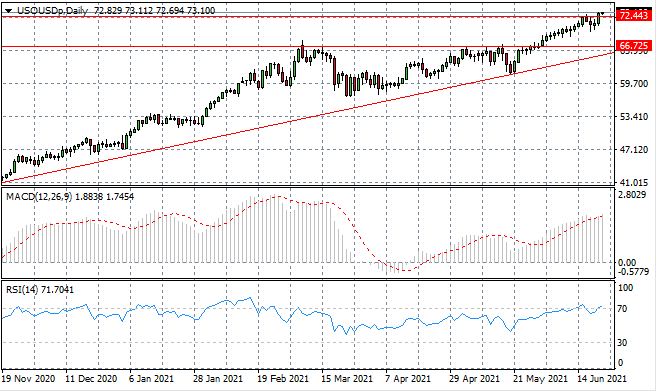
USOUSD
The USOUSD has finally broken the 72.44 resistance level as buyers found support in yesterday’s trading. The question is whether the break will last. Supply fundamentals are providing support to the commodity which has a well-established uptrend. Momentum indicators are testing overbought conditions.
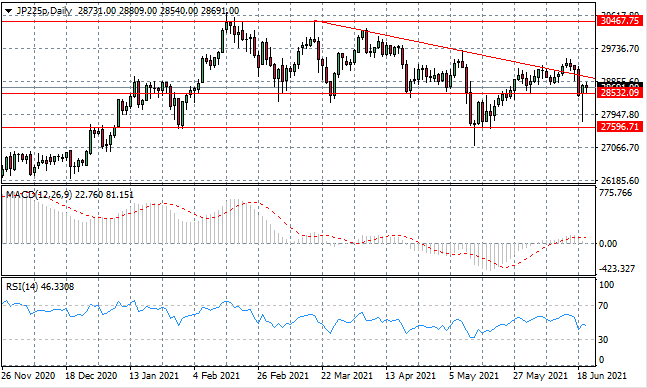
JP225
The JP225 has rebounded from the 27,596 support level amid massive buying pressure in yesterday’s trading. A doji candle in today’s trading represents indecision, as price action has been taking back towards the descending trendline, which has been a key resistance area. Momentum indicators have downward trajectories.
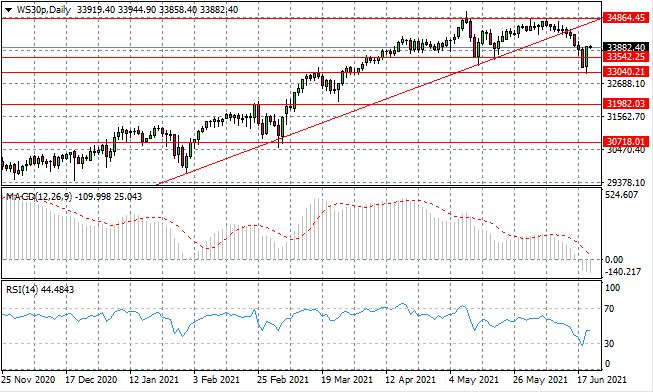
WS30
The WS30 has returned to a previous range between the 33,542 and 34,864 price levels, after rebounding from the 33,040 support line. The index may now consolidate within range. Momentum indicators have sharp upward trajectories and are undergoing reversals.