WS30 Hits Multi-Year Highs
- 11 Mar 2021
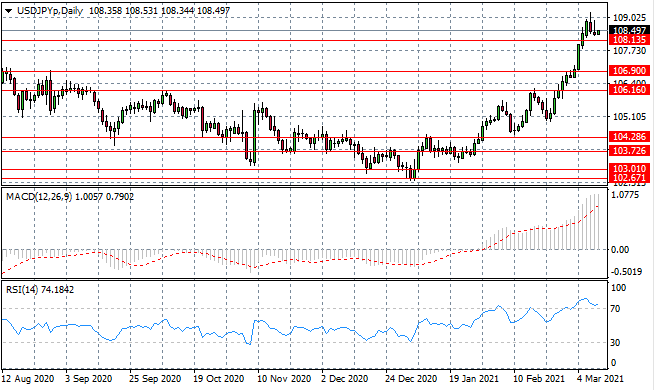
USD/JPY
The USD/JPY rally has started to reverse with an increase in selling pressure in the last two trading sessions. Conviction currently remains low, however, with price action fading towards the 108.13 support level. Momentum indicators have flattened in bullish territory, with RSI turning back to the 70 overbought line.
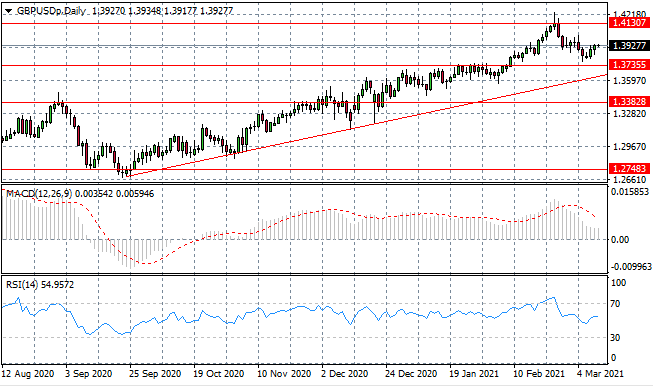
GBP/USD
The GBPUSD pair looks set to oscillate within the current range in the near-term, as buyers returned when the pair moved towards the 1.373 support level. Buying activity remains subdued currently. Momentum indicators have flattened in bullish territory.
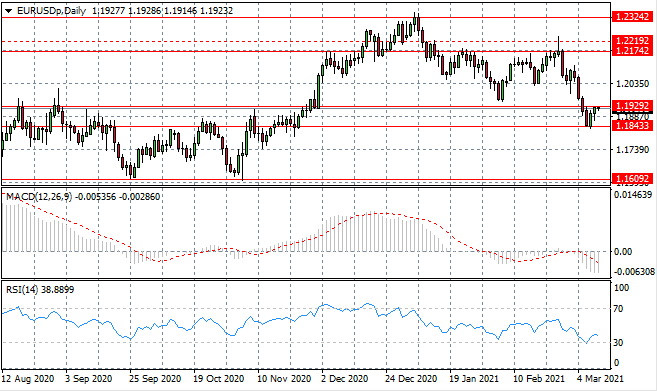
EURUSD
Eurodollar buyers have climbed towards the 1.192 resistance line once again, in the first sign that the sell-off has ground to a halt. A return to the previous trading range seems likely in the next few trading sessions, especially if buying momentum continues. Momentum indicators have flattened in bearish territory.
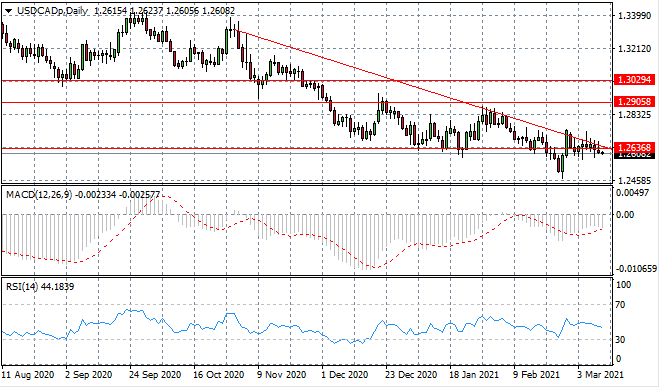
USDCAD
The USDCAD has broken the lower bound of a descending triangle, as oscillations continue to narrow; a bearish breakout seems likely. The descending trendline will continue to act as a resistance level. Momentum indicators have flattened in bearish territory.
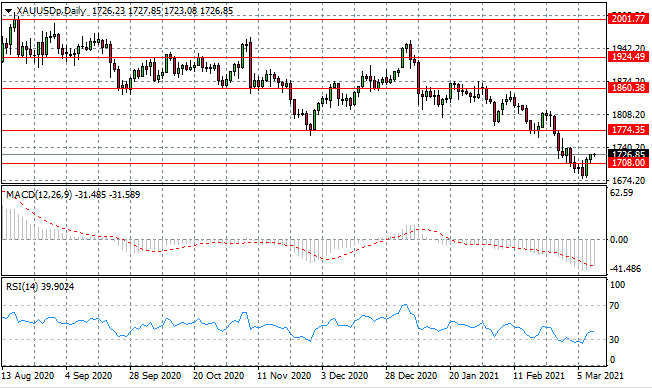
XAUUSD
XAUUSD has broken the 1708 price line, once again, as bearish moves begin to fizzle out. The next target will be the 1774 resistance level, yet the question is whether there is enough conviction from buyers. Momentum indicators have upward trajectories.
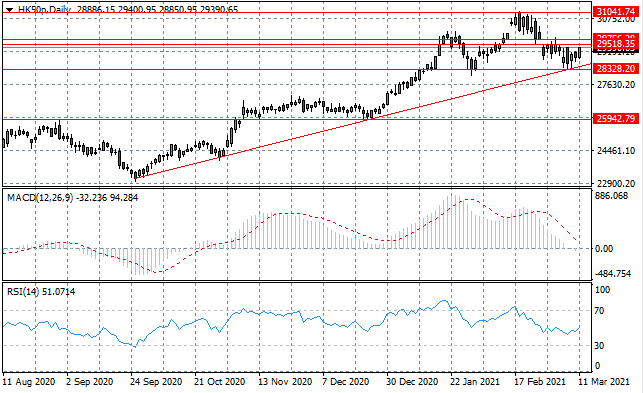
HK50
The HK50 is returning towards a gap-fill line at the 29518 price level which represented a previous breakaway gap. If the index can overcome this resistance area, the rally may begin to gather steam. The ascending trendline remains a key support area. Momentum indicators are in neutral/bearish territory.
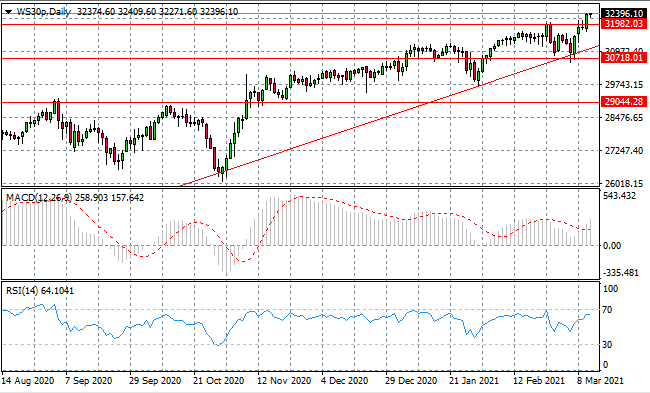
WS30
The WS30 has broken the 31982 level to the upside, as strong bullish moves have facilitated the break. A clear, established and long-term rally is set to remain intact. The break has taken the index to a multi-year high. Momentum indicators have upward trajectories with RSI approaching the 70 overbought line.