The US Dollar Continues To Suffer At End Of Trading Week
- 6 Mar 2020
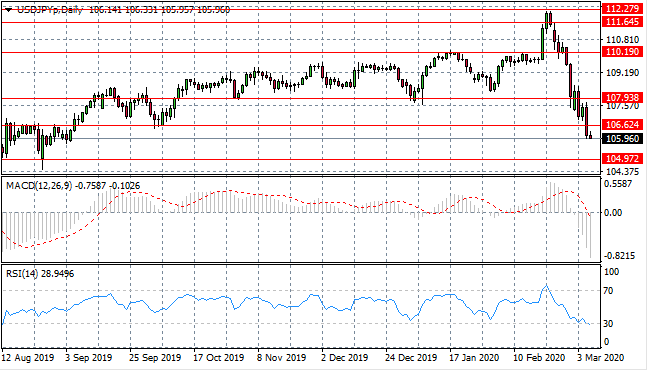
USD/JPY
The USD/JPY sell-off continues as the US Dollar comes under pressure despite a rate cut from the Fed. Strong conviction from sellers took price action beyond the 106.62 support level. Selling activity continues in early trading today which may result in price action heading towards the 104.97 support level. Momentum indicators have downward trajectories and RSI continues to test the 30 oversold line.
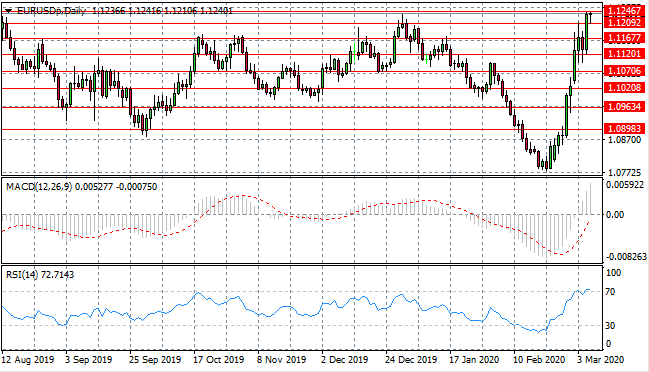
EUR/USD
The Eurodollar continues to make ground on the US Dollar which has now taken price action towards the 1.124 resistance area which represents a recent price ceiling. Buying pressure remains which is being driven more by fundamentals than technical factors. Momentum indicators have upward trajectories, however, RSI has reached the 70 overbought line.
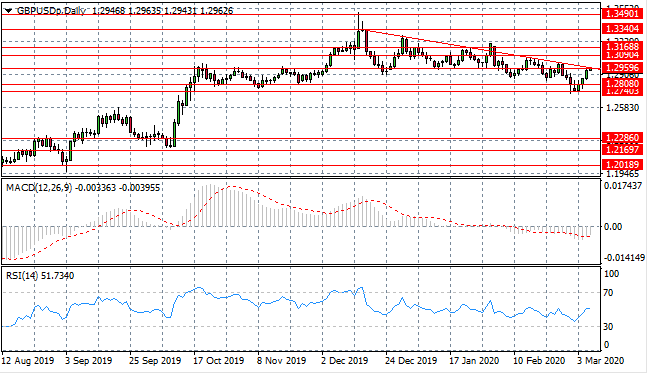
GBP/USD
The GBP/USD pair is once again testing the descending trendline, which on previous occasions, has resulted in a pullback in price action. This remains a key resistance area for the pair therefore any break would be significant. The longer-term trend is bearish. Momentum indicators have flattened in neutral/bearish territory.
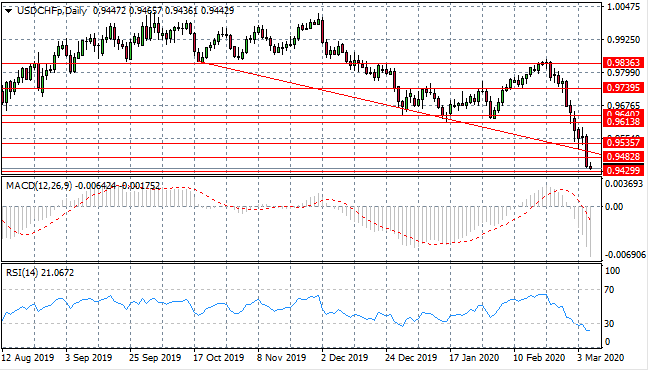
USD/CHF
The USD/CHF sell-off continues as US Dollar weakness remains, taking price action back towards the 0.942 support level. This price area represents a long-term support level which the pair had a significant rebound from previously. Momentum indicators have sharp downward trajectories, however, RSI has broken the 30 oversold line.
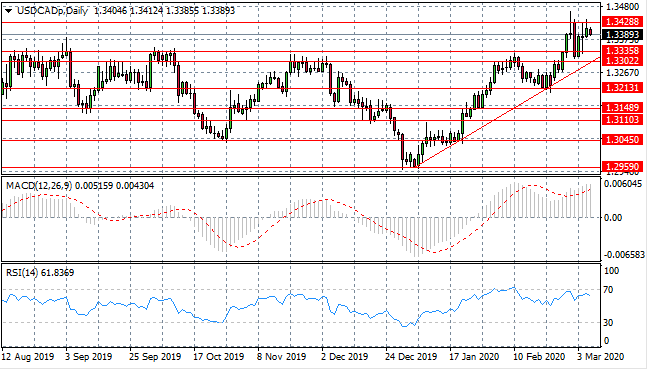
USD/CAD
The USD/CAD pair remains volatile with buyers and sellers dominating alternate trading sessions. Sellers have returned at the 1.342 resistance area as the pair is once again unable to clear this price hurdle. The long-term trend is bullish and generally pullbacks have been followed by bullish moves. Momentum indicators remain in bullish territory yet RSI has fallen short of overbought conditions.
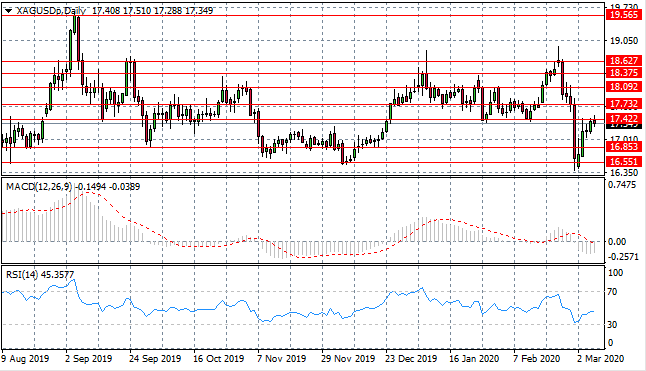
SILVER
Buyers have returned to Silver in emphatic fashion, taking price action through several resistance levels to test the 17.42 price area. This price area represents a previous support area for the pair and a move beyond this price area would represent the return to a previous trading range. Momentum indicators have upward trajectories and are moving out of bearish conditions.hfhhg
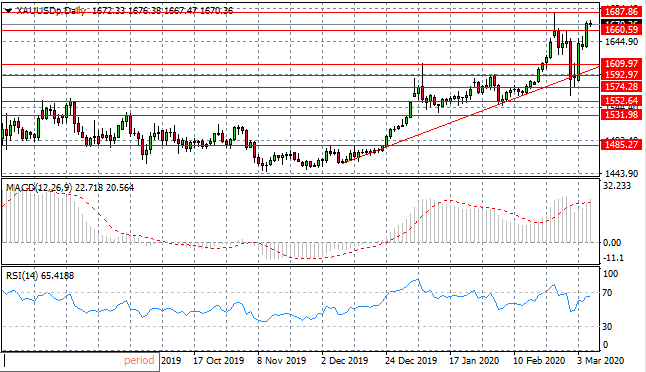
GOLD
Gold buyers have returned to take price action beyond the 1660.59 resistance area. The metal is moving towards a previous price high at the 1687.86 price level which it hit as a result of tensions in the Middle East. Arguably, the virus outbreak represents another black swan event for the market yet the situation has taken longer to play out. Momentum indicators have flattened in bullish territory.
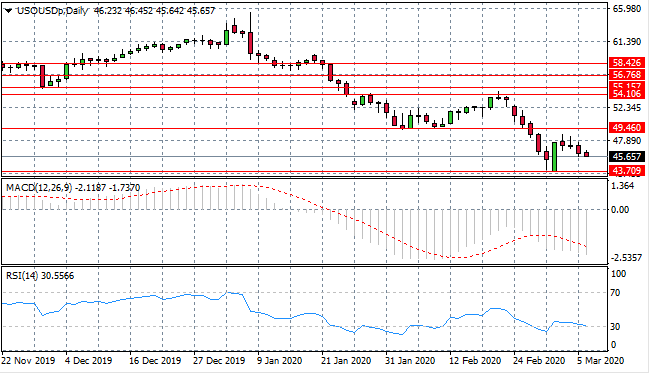
OIL
WTI is once again coming under pressure with selling momentum beginning to climb. Price action is heading back towards the 43.70 support level once again as the commodity fails to move beyond the 49.46 resistance area, to break the $50 per barrel mark. Momentum indicators have flattened in bearish territory.