Daily Insights Report 23/05/17
- 23 May 2017
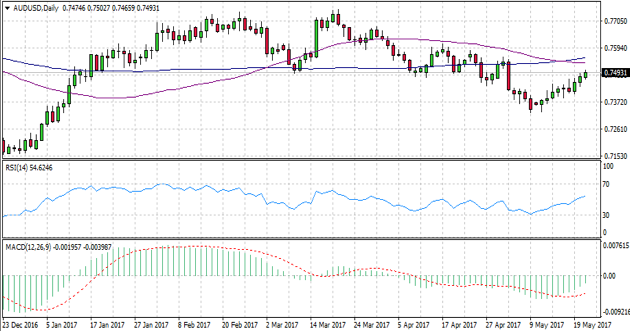
AUD/USD
The AUD/USD is showing signs of bullish momentum. A crossover of the 50-day moving average over the 100-day moving average indicates bullish momentum in the near-term. Price action appears to be approaching the pair and a crossover is further confirmation of price direction. The trajectory of both MACD and RSI confirm the uptrend.
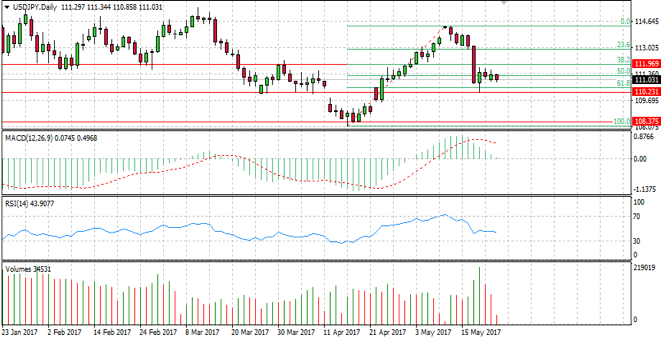
USD/JPY
The USD/JPY pair has retraced significantly after a marked uptrend since the start of April. Price action appears to have found support at the 50 Fibo level. If price continues towards the 61.8 Fibo level and breaks the 110.23 support level, a bullish reversal may take place. Volume appears to be declining indicating little appetite to take the price lower. RSI has flattened although is not in oversold territory and MACD has a downward trajectory.
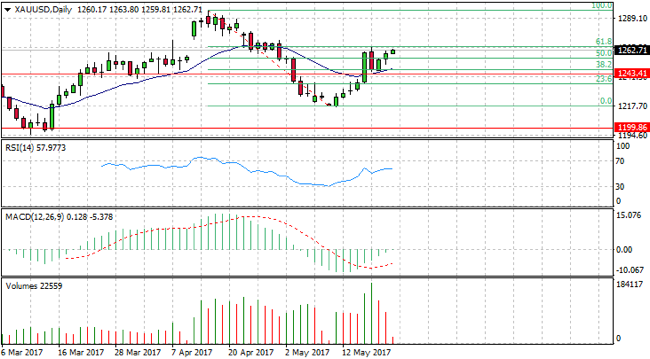
GOLD
Gold has retraced from a downtrend in April. Price action has almost reached the 61.8 Fibo retracement level, indicating a potential bearish reversal. Volume appears to be declining indicating the current trend may be losing steam and RSI has flattened indicating some stall in momentum. MACD is currently bearish.
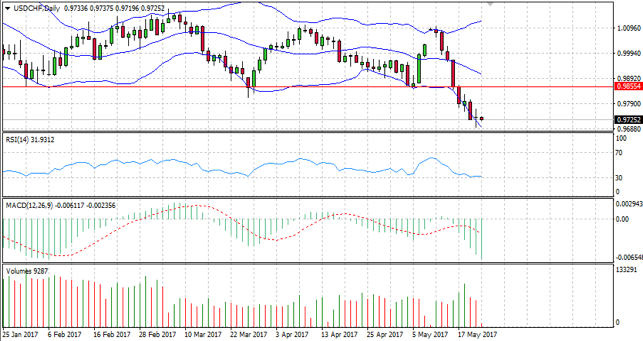
USD/CHF
The USD/CHF pair has broken a significant support level at 0.9855 and prices have continued to decline. Several breaks of the lower Bollinger band and the ‘flattening’ of RSI at the 30 ‘support’ level indicate the asset may be oversold. A doji candlestick at the bottom of the trend represents indecision and may indicate waning demand from sellers, which is further confirmed by declining volume.