Daily Insights Report 30/05/17
- 30 May 2017
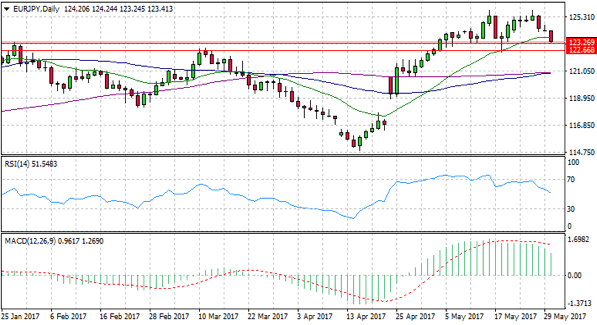
EUR/JPY
The EUR/JPY pair has broken through the 20-day exponential moving average and has hit a support level at 123.26. If it continues through this level the next price target will be the 122.66 support level. RSI has sharply fallen from the overbought area and MACD appears to be heading towards the zero line. There is a potential crossover of the 50-day moving average and the 100-day moving average and the direction of the cross will confirm the near-term direction for the pair.
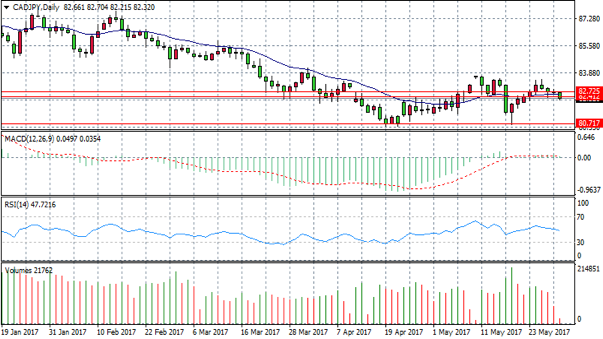
CAD/JPY
The CAD/JPY pair appears to be in a long-term downtrend with a flag formation pattern. It appears the downtrend will continue despite some effort from buyers to push prices higher. Price action has failed to break the 82.72 line and the 20-day exponential moving average also appears to be providing resistance to the pair. MACD is flat on the zero line and RSI has a downward trajectory. Volume is declining which suggest little conviction from buyers to push prices higher.
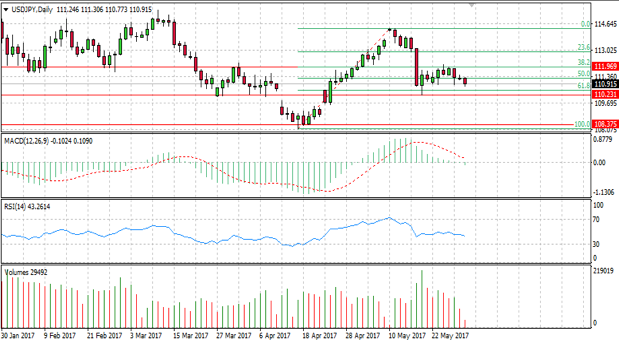
USD/JPY
The USD/JPY pair has broken the 50 Fibo level and is heading towards the 61.8 level. There is also a significant support line at 110.23 providing a support zone with the 61.8 Fibo level. There is a potential bullish reversal if price action reaches this level. MACD has broken the zero line and RSI is flat indicating near-term momentum is still bearish. Volume is declining however, which suggests that the trend could be losing steam.
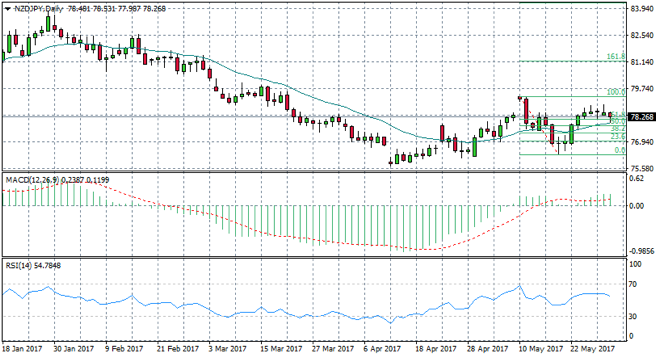
NZD/JPY
The NZD/JPY pair has found support at the 61.8 Fibo line, however, there are indications of selling pressure. The current trading session saw prices pierce through the 61.8 Fibo level and touch the 20-day exponential moving average (which currently acting as support). RSI has a negative trajectory yet MACD remains positive. Volume is declining which may indicate some indecision from the market. If price action breaks the support levels then the bearish reversal can be confirmed.