Daily Insights Report 22/02/17
- 31 Mar 2017
22 Feb 2017
Flash Markit US Manufacturing data showed a decrease to 54.3 in February from an almost two year high of 55 in the previous month. Figures came below market expectations of 55.3.
The Euro fell 0.6% against the USD in yesterday’s day of trading. This likely comes after more uncertainty about the French political situation and Greece’s debt situation came closer to the light. Trading at $.10545 it also lost 0.7% against the Pound at GBP 0.8454.
The Dollar rose 0.4% against the Yen to reach 113.55 per Dollar. The main reason why the Dollar likely gained some traction is because of comments by Patrick Harker (Head of the Federal Reserve Bank of Philadelphia). He mentioned that increasing the interest rate in the month of March remained a strong possibility.
Commodities
– Gold was hurt by a strong Dollar and it fell $2 to reach $1,235 an ounce
– Both Brent and West Texas Intermediate (WTI) crude were up. Brent enjoyed a 0.9% gain to reach $56.66 a barrel, and WTI was up 1.2% to reach $54.02 a barrel. OPEC’s most senior official said that the cartel intends to achieve full compliance by all participants.
United States Dollar (USD)
Existing Home Sales
The expectation is that the data will show 5.55 million existing home sales in January. This would be an increase since December. Looking at yearly data, sales rose 7% year-over-year in the fourth quarter, keeping the housing recovery steady and growing at a modest pace. Homeowners are likely to continue selling in the coming months because inventory is running low.
FOMC Meeting Minutes
Meeting Minutes from the uneventful February FOMC meeting will give some idea about the direction that policymakers think growth and inflation will go. The outlook for the economy is not clear to anyone because of the impact of proposed policies of the new Presidential administration. There are some upward pressures on price and wages that keep the Federal Reserve on track to increase the interest rate three times this year (as it was mentioned at the end of last year).
Technical Analysis
GBPJPY
This four-hour chart of the GBPJPY pair shows a triangle that is forming. Since the middle of January, the trend of this triangle has held true as the value hardly crosses through the boundaries.
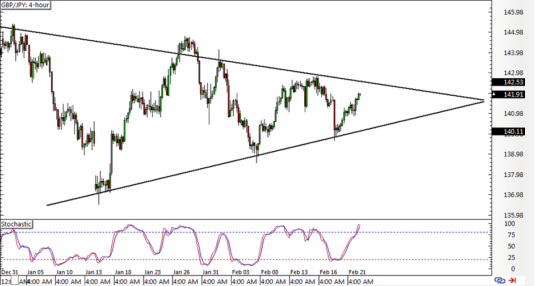
The stochastic indicators show that this pair is already overbought. Data that has come from the UK has shown that there is a slowdown soon. Yesterday’s press conference, the Bank of England stated that they would not be able to predict the next financial crisis – a cause for worry for investors.
Recent currency fluctuations across the majors has shown that there is a lot more to determine the exchange rate in addition to the economic calendar. For this pair, fundamental data can be found for upside and downside movements.
