The U.S. Dollar Struggles At Beginning Of Trading Week
- 9 Jun 2020
USD/JPY
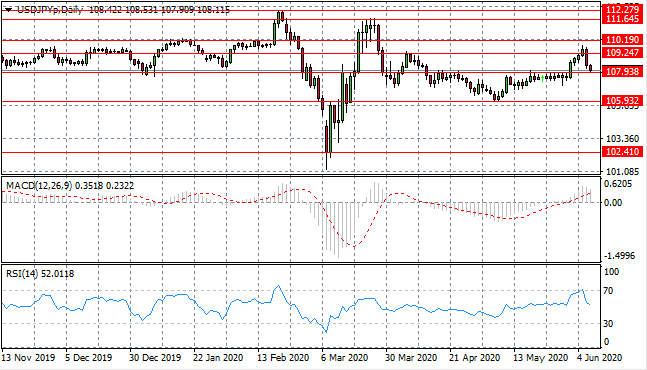
The USD/JPY pair has plunged back towards the 107.93 support level as sellers return in emphatic fashion. The support level represents the floor of a previous trading range, therefore a break would indicate that a near-term trend is yet to be established. Momentum indicators remain in bullish territory, yet are pulling back from overbought conditions.
EUR/USD
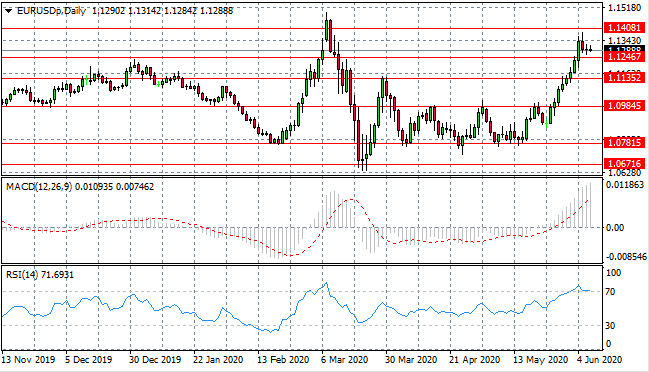
The Eurodollar has pushed beyond the 1.124 resistance line, yet significant selling activity has begun after the break. However, a series of doji candles indicate that sellers lack conviction. Momentum indicators remain bullish yet RSI is returning towards the overbought ’70’ line.
GBP/USD
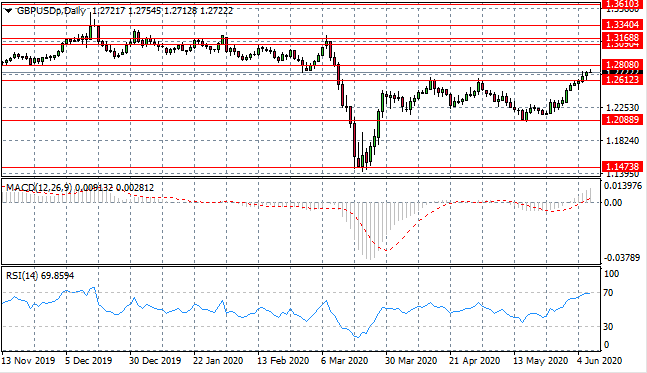
The GBP/USD pair has finally broken the 1.261 resistance level and is heading towards the 1.280 price level which represents the floor of a previous trading range. Momentum indicators remain in bullish territory and RSI is testing the overbought resistance line at 70.
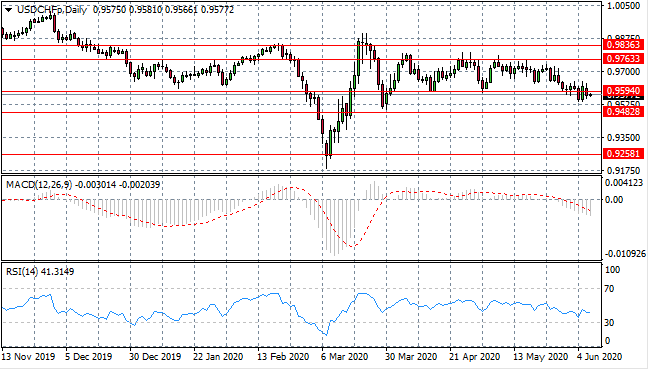
USD/CHF
The USD/CHF pair has returned to the 0.959 support level as the pair continues to oscillate around this price level. The support level represents a break of a price floor in the 0.959- 0.976 trading range yet sellers have yet to dominate price action. Momentum indicators remain in bearish territory.
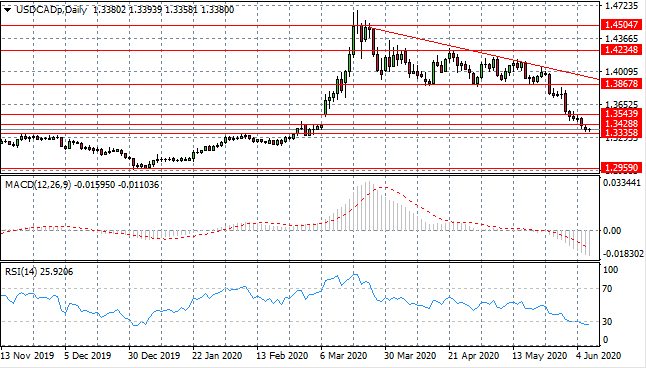
USD/CAD
The USD/CAD breakout has gathered significant support, taking price action towards the 1.333 price level as the pair returns to price levels seen before the Covid-19 breakout. Momentum indicators remain bearish yet RSI has pushed beyond the 30 oversold line.
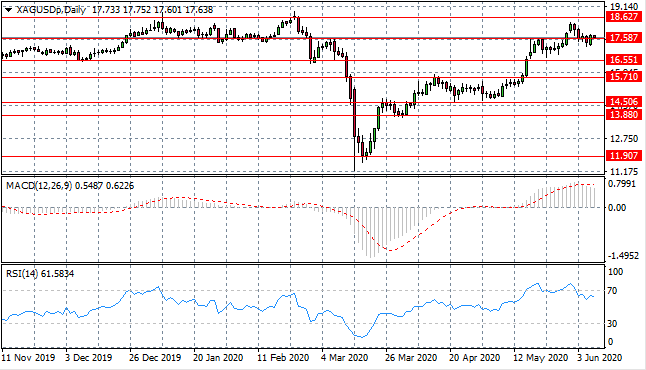
SILVER
Silver has returned to the 17.58 price line yet price action has stalled with neither buyers or sellers having strong conviction. The pullback may be a short rest period before another drive higher. Momentum indicators appear to be undergoing reversals.
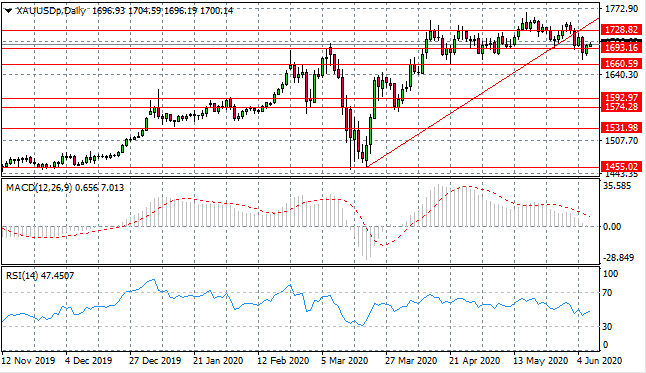
GOLD
Gold buyers have returned to the metal to drive price action back towards the 1728 price area once again. The pair may oscillate between the 1693 and 1728 price levels for the near-term and in the absence of any good news. Momentum indicators have bearish trajectories with MACD approaching the zero line.
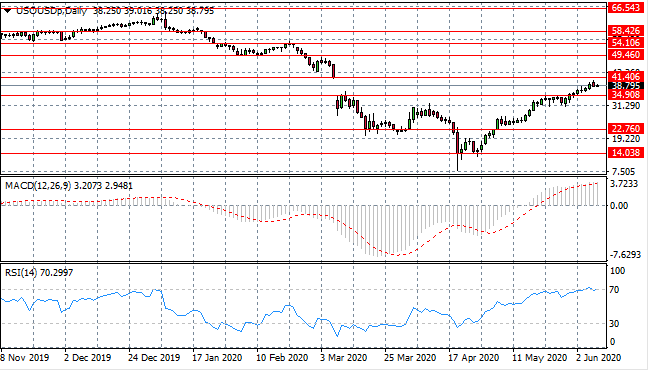
OIL
WTI has finally broken the 34.90 resistance level, which is significant as it represents a gap fill line from the previous downtrend. Price action is now closing the gap and is reaching the 41.40 price level and a break would give the rally real traction. Momentum indicators remain in bullish territory although RSI suggests oil is overbought.