USDJPY Moves Higher
- 15 Mar 2021
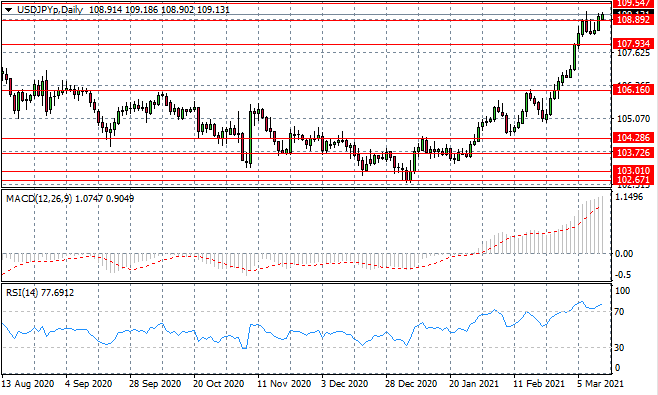
USD/JPY
The USD/JPY rally has moved beyond the 108.89 price level, which represents a long-term price high. The next target is the 109.54 price line which represents a resistance level not touched since May 2020. Momentum indicators are bullish with RSI indicating the pair is overbought.
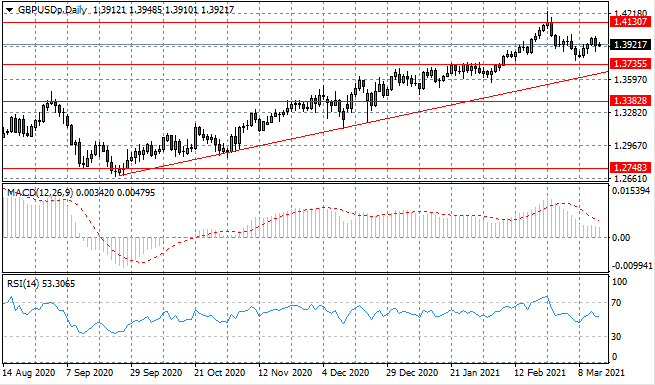
GBP/USD
GBPUSD price action remains contained within the trading range between the 1.373 and 1.413 price levels. Oscillations have begun to narrow as the ascending trendline approaches, which has previously acted as a key support level. Momentum indicators have stalled in bullish territory.
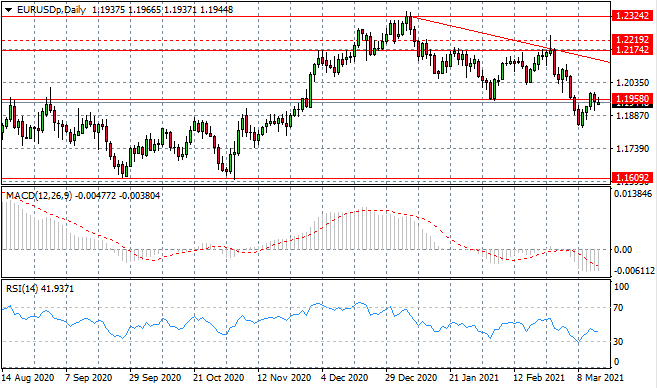
EURUSD
The Eurodollar has been unable to move beyond the 1.195 price level, with sellers returning. Price action has therefore been contained within the 1.160-1.195 trading range. A longer-term downward trajectory for the pair appears to be forming, yet moves are likely to be dictated by the US Dollar. Momentum indicators have stalled in bearish territory.
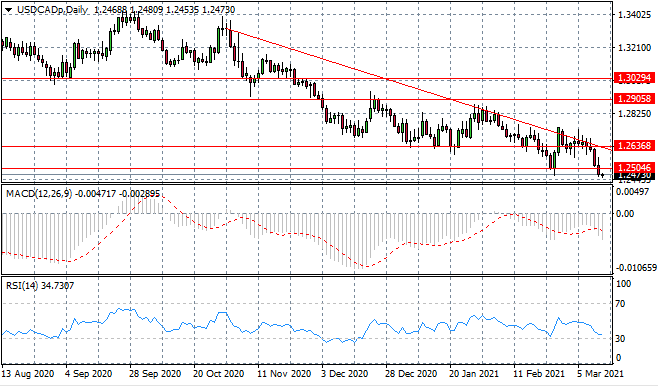
USDCAD
The USDCAD breakout is underway, as the lower bound of a descending triangle and the 1.250 support line have been broken. The descending trendline will continue to act as a resistance level. Momentum indicators remain in bearish territory, with RSI approaching oversold conditions.
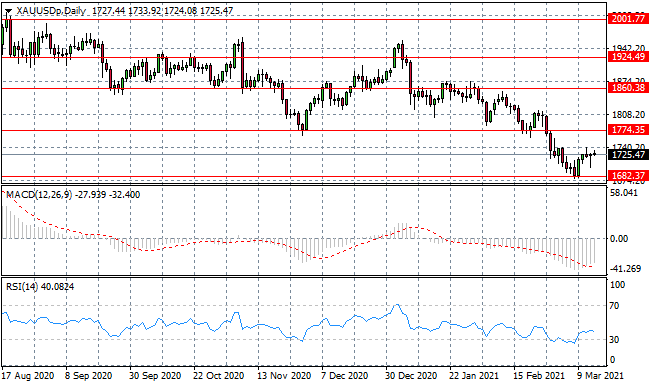
XAUUSD
XAUUSD has rebounded from the 1682.37 support level, yet the uptrend has stalled mid-range between the 1682.37-1774.35 price levels. Doji candles represent indecision for the pair with neither buyers or sellers dominating price action. Momentum indicators have upward trajectories.
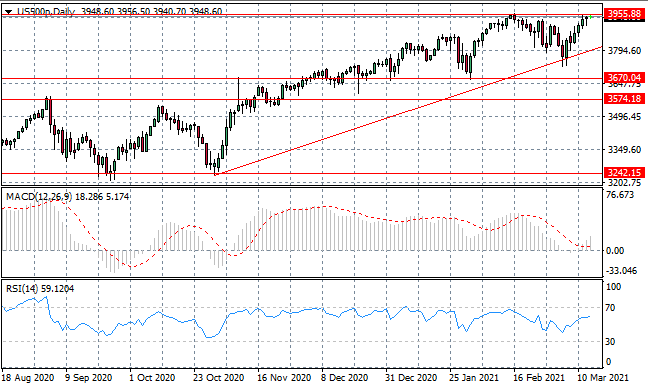
US500
The US500 is returning to the price high at the 3955.68 resistance level, after another rejection of the ascending trendline. This has been a significant hurdle for the index in the past, as previous attempts have resulted in a bearish pullback. Momentum indicators have upward trajectories.
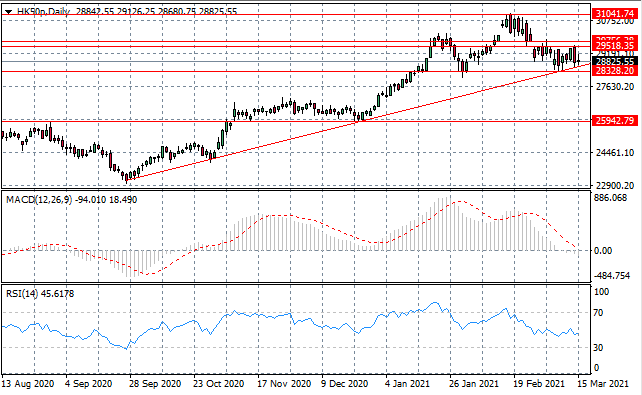
HK50
The HK50 is bouncing back from the ascending trendline, as volatility continues. A long-term rally has been established since the end of September and given the failed tests of the trendline, bullish momentum looks set to continue. Momentum indicators have flattened in bearish territory.