USDCAD To Fade Lower
- 17 Mar 2021
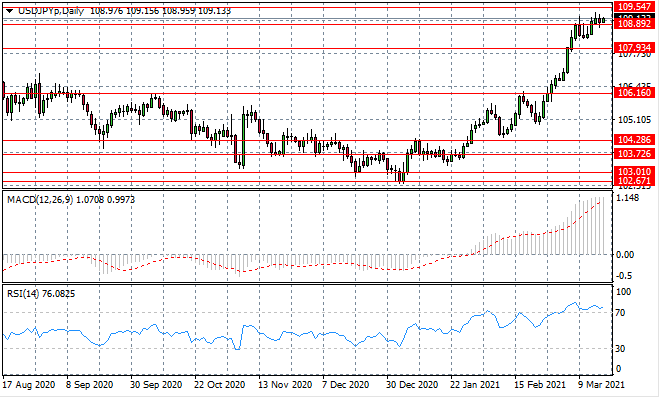
USD/JPY
The USD/JPY rally has stalled at the 108.89 support level, as price action begins to flatten and selling pressure puts an end to the rally. The next few sessions will determine whether the slowdown is a precursor for a reversal or simply a break in the rally. Momentum indicators have flattened in bullish territory with RSI bouncing along the overbought line.
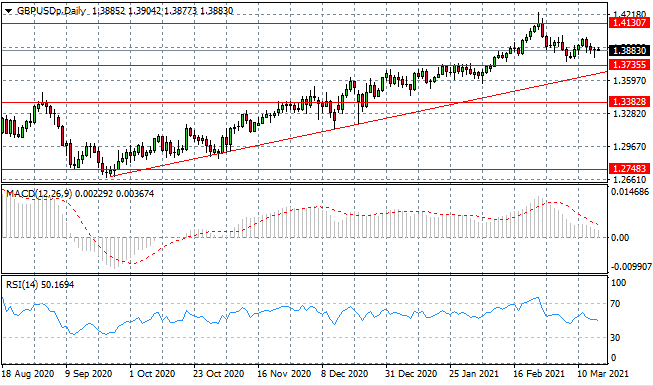
GBP/USD
The GBPUSD pair remains within range between the 1.373 and 1.413 price levels. Oscillations continue to narrow, which generally precedes a breakout. The ascending trendline has been established as a key support. Momentum indicators have flattened in neutral/bullish territory.
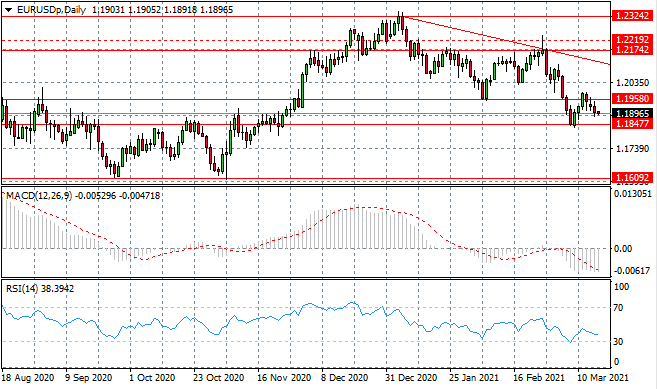
EURUSD
The Eurodollar has pulled back from the 1.195 price level, which represents the lower bound of a previous trading range. Weakness persists for the Euro which is forming a long-term bearish trajectory. This recent rejection may now result in the pair ranging within the 1.184-1.195 range. Momentum indicators have stalled in bearish territory.
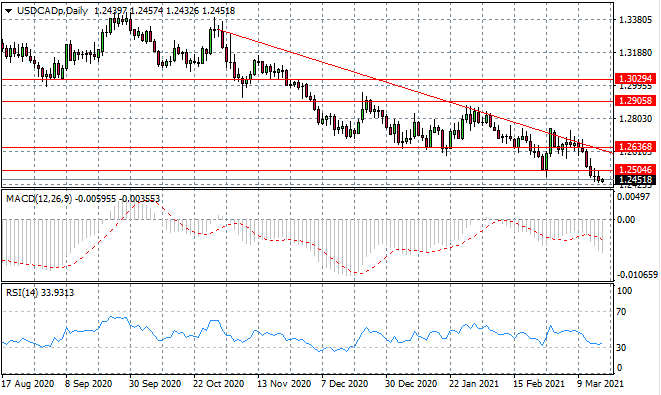
USDCAD
The USDCAD breakout has seen a stall in bearish momentum, yet buyers appear to lack the conviction to revers recent price moves. A fade lower seems most likely for the pair especially in the absence of any significant changes in fundamentals. Momentum indicators remain in bearish territory, with RSI testing oversold conditions.
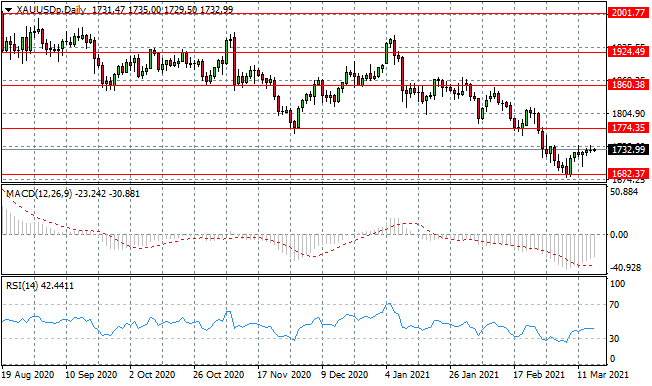
XAUUSD
XAUUSD has found support after hitting the 1682.37, yet, buyers conviction remains weak. A target exists at the 1774.35 which represents a previous trading range. The metal’s trajectory will continue to be influenced by appetite for the US dollar. Momentum indicators have moderate upward trajectories.
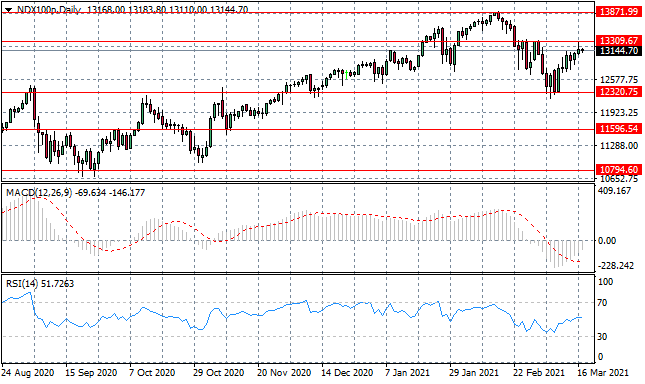
NDX100
The NDX100 is moving towards the 13309.67 resistance line, with a test in yesterday’s trading session resulting in a rise in selling pressure. Buyers appear to be making another attempt at the resistance area and given the number of tests, a break seems inevitable. Momentum indicators highlight further upside potential, with established upward trajectories.
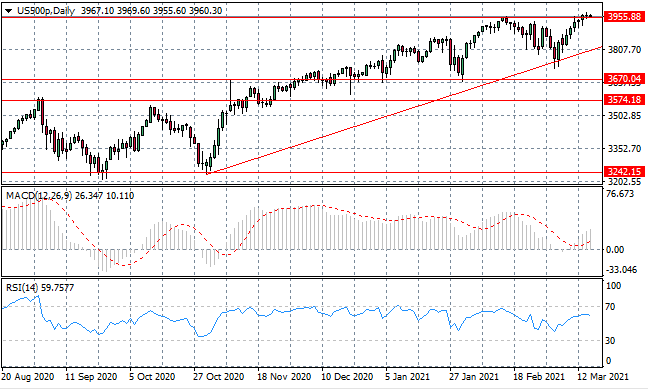
US500
The US500 has struggled to break through the 3955.88 resistance area, with pullbacks typically only going as far as the ascending trendline. An ascending triangle pattern is forming which is a bullish continuation pattern, indicating that a break is probable. Momentum indicators have flattened in bullish territory.