USOUSD Price Recovery
- 25 Aug 2021
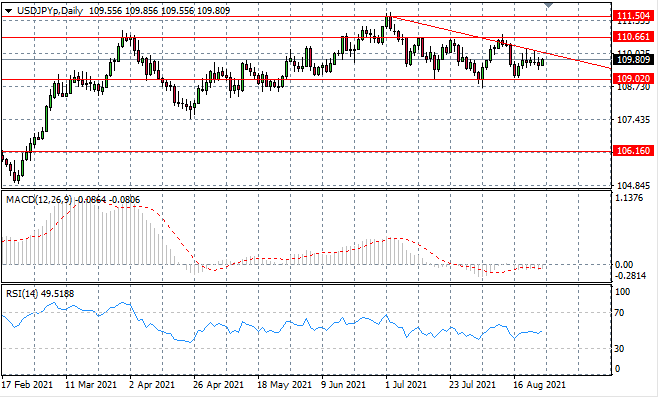
USD/JPY
The USDJPY pair is moderating towards the upper bound of the descending triangle. A series of small-bodied candles suggest indecision from both buyers and sellers. Several tests of the upper trendline have not resulted in a break and therefore we may anticipate a bearish breakout in the medium-term. Momentum indicators have flattened in neutral territory.
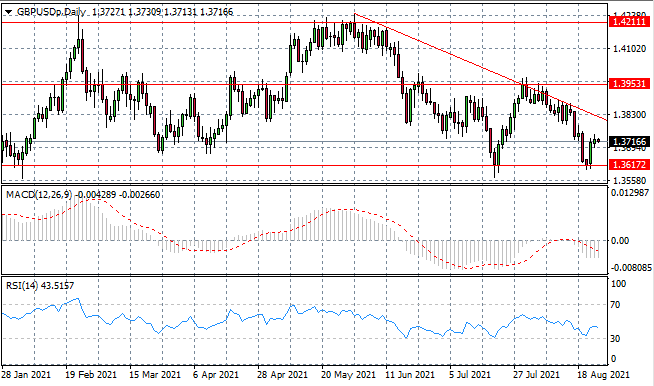
GBP/USD
The GBPUSD pair has stalled after a strong price recovery took price action back towards the mid-line of a consolidation channel. The pair is likely to continue oscillating within this range, contained by the trendline. Momentum indicators remain in bearish territory.
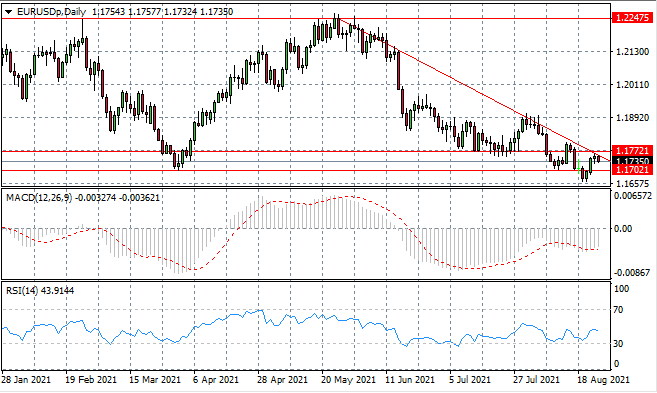
EURUSD
The Eurodollar has pulled back once again after a test of the descending trendline further confirming the strength of this resistance area. Price action will likely head back towards a key support level at the 1.170 price line. Momentum indicators remain in bearish territory with RSI indicating further downside potential.
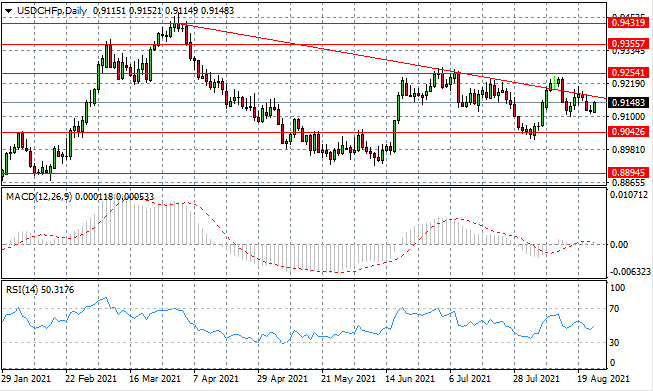
USDCHF
USDCHF will return to the descending trendline as buyers have been revived in early trading. So far the trendline has contained any rally attempts and the pair oscillates within the current range between the 0.904 and 0.925 price levels. Momentum indicators are neutral/bullish.
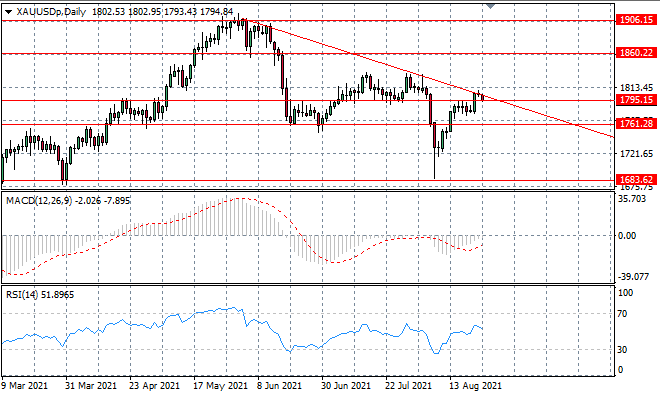
XAUUSD
XAUUSD is back testing the 1795 support level, as recent bullish moves have been thwarted by the trendline and hence, price action may now return to the 1761-1795 consolidation channel. Longer-term, sentiment remains bearish yet moderate swings indicate buyers are still active. Momentum indicators have upward trajectories.
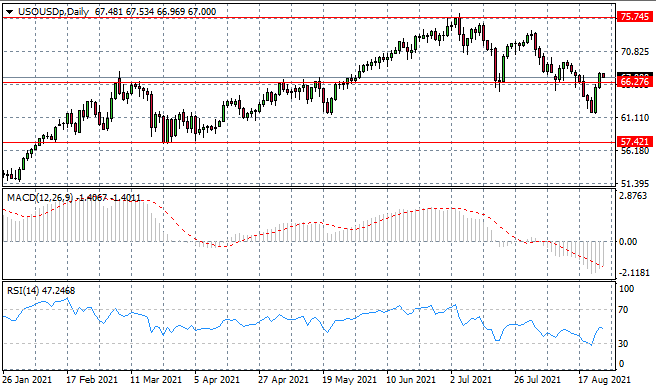
USOUSD
The USOUSD bulls have found their conviction to drive a break back above the 66.27 resistance line. The price recovery could spell the end of the recent bearish bias which aimed to see the $60 per barrel range as a target. Profitability rises at current price levels and represents a truer reflection of demand. Momentum indicators are bullish.
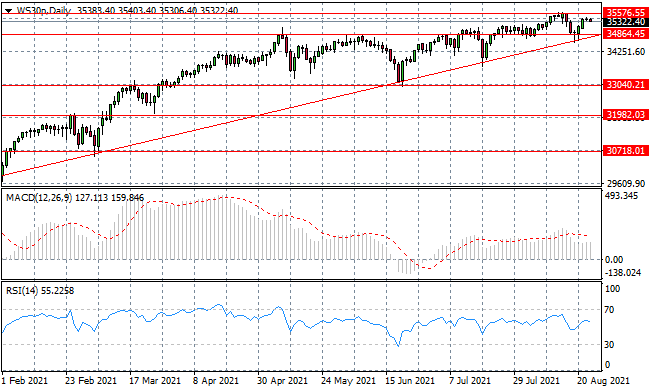
WS30
The WS30 index is moving back towards a recent price high at the 35,576 resistance line where the rally began to fade. A touch of the 34,864 support level inspired the return of buyers where price action had been narrowing in a tighter trading range between these two price levels. Buyers’ conviction will be tested. Momentum indicators remain in bearish territory.