Eurodollar Reversal On The Cards?
- 26 Aug 2021
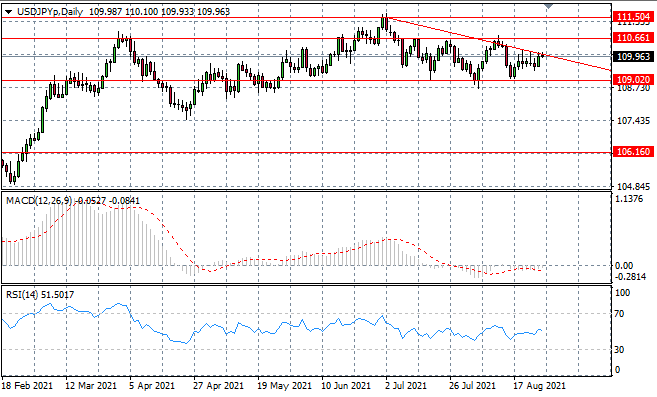
USD/JPY
The USDJPY pair has stalled once again at the upper bound of the descending triangle. Strong bullish conviction in yesterday’s trading suggested a break was a possibility, yet sentiment appears to be waning in the early Asian trading session. Momentum indicators have flattened in neutral territory.
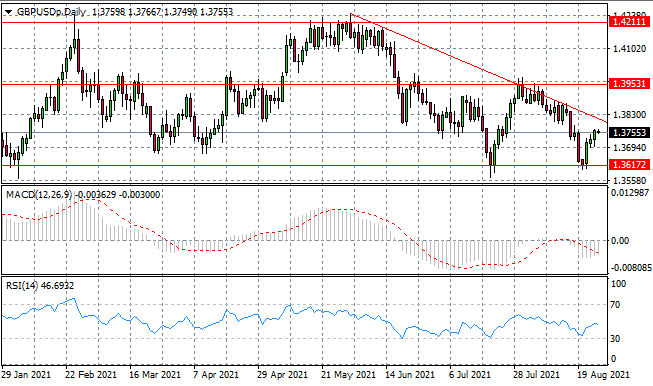
GBP/USD
The GBPUSD pair is making progress back towards the trendline which has contained any previous rally attempts. Given the fact that bullish sentiment appears to be waning into the move, a break seems unlikely for the pair at this point. Momentum indicators have upward trajectories.
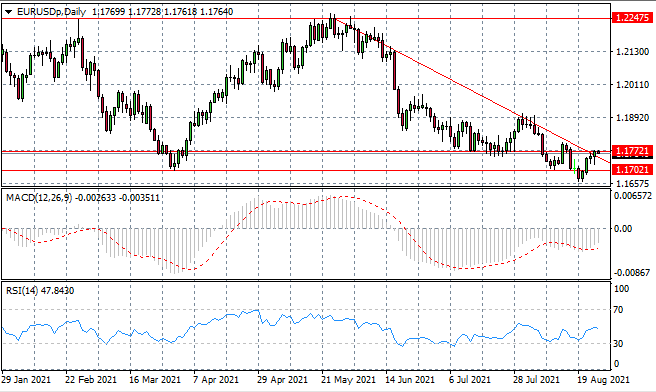
EURUSD
The Eurodollar appears to have moved beyond the trendline which has represented a strong resistance zone since May. Currently, price action is testing the 1.177 resistance area and a break would indicate a trend change. Momentum indicators are moving away from the oversold zone, with upward trajectories.
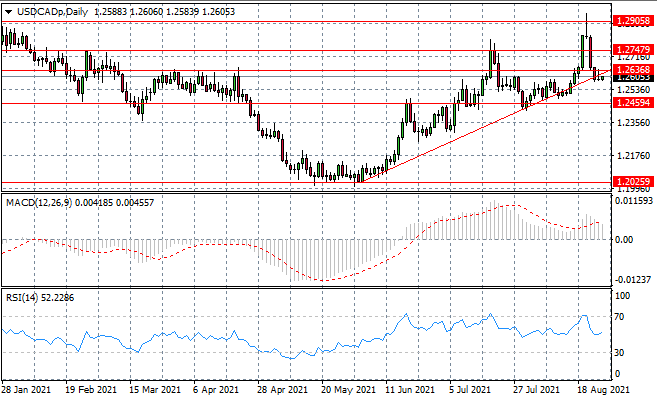
USDCAD
The USDCAD has stalled, once again, at the trendline, having broken a key support level at the 1.263 price line. A doji candle in yesterday’s trading represents a slowdown in bearish sentiment. The question is, therefore, whether the break can be sustained. Momentum indicators have stalled in bullish territory.
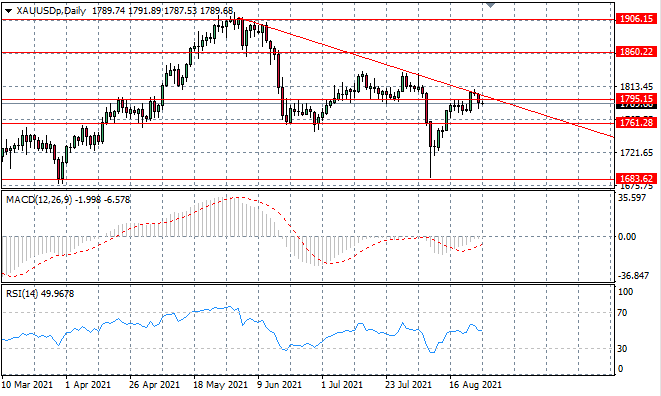
XAUUSD
XAUUSD has rejected the trendline and crossed back over the 1795 support line, as bearish sentiment begins to rise and influence price action. The next target will therefore be the lower bound of a consolidation channel at the 1761 price line. Expect price action to oscillate between these two price levels going forward. Momentum indicators have upward trajectories.
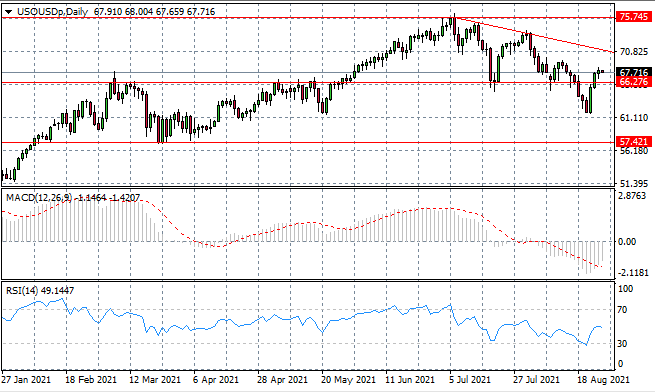
USOUSD
The USOUSD now has the descending trendline in sight as the bearish bias in recent months may be reversed. The ability to reverse a longer-term trajectory will be determined by buyers’ conviction. Currently bullish momentum appears to be weakening and therefore we may expect price action to oscillate within the current range. Momentum indicators are bullish.
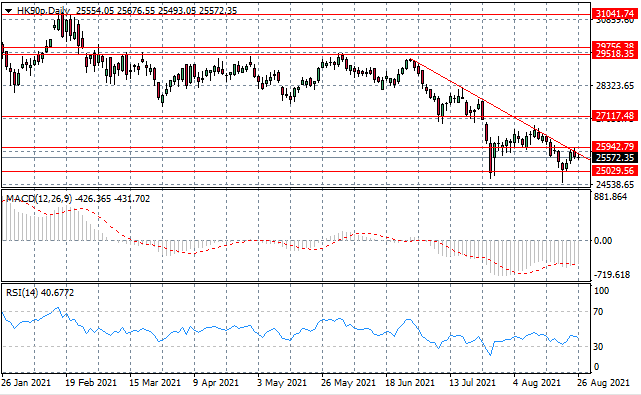
HK50
The HK50 index continues to test the descending trendline which is a well established resistance zone. Each test has resulted in a rejection and subsequent selling action. Bullish moves into the attempted rally appear subdued and therefore, we may expect another test of the 25,029 support level in the near-term. Momentum indicators remain in bearish territory.