GBPUSD Breaks Key Resistance Line
- 3 Sep 2021
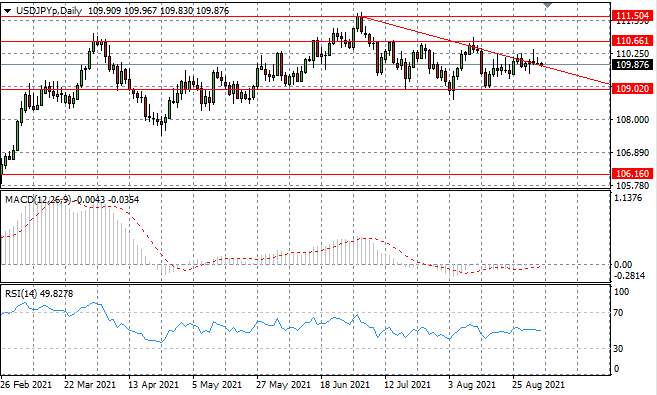
USD/JPY
The USDJPY pair has failed to move beyond the descending trendline as selling pressure rises each time a break attempt is made. The pair will likely hug the trendline downwards with a breakout more likely as the pair moves closer to the apex. Momentum indicators have flattened in neutral territory.
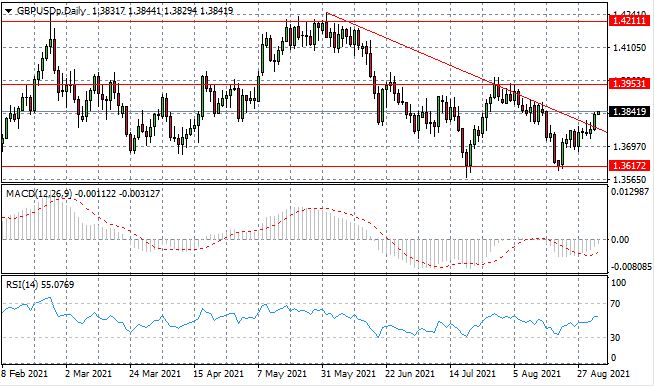
GBP/USD
The GBPUSD has broken the descending trendline in the first sign of a shift in sentiment. Bullish momentum appears strong, with the 1.395 resistance level in sight. A return to this price line would confirm a price recovery. Momentum indicators have turned bullish.
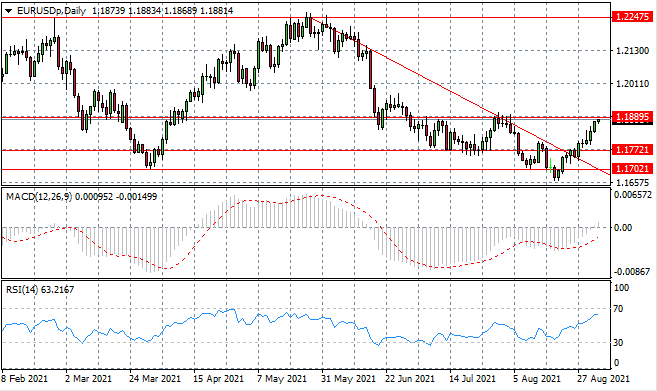
EURUSD
The Eurodollar is moving to test the 1.188 resistance level which is the top of the current trading range, representing the upper bound of a consolidation channel. A break would put the pair in a position to fully recover from the recent downtrend. Momentum indicators are bullish.
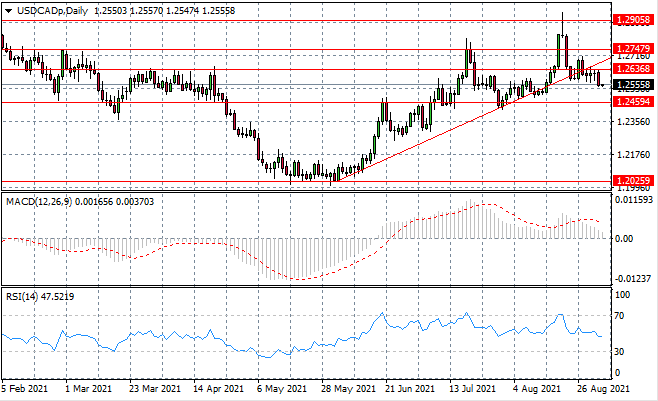
USDCAD
The USDCAD has broken the descending trendline and bearish sentiment will now take price action back towards the 1.245 support level. Given the length of time the trendline held as a support, the move indicates a longer-term shift in sentiment. Momentum indicators have downward trajectories.
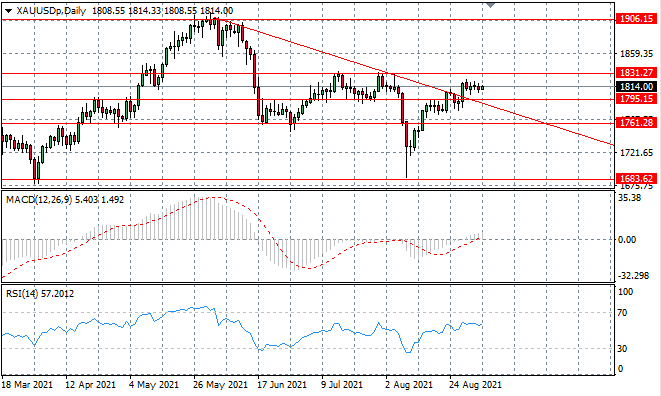
XAUUSD
The XAUUSD has begun to trade sideways with doji candles indicating that neither buyers nor sellers have the conviction to drive price action currently. The metal may, once again, consolidate within the current channel. Momentum indicators are bullish.
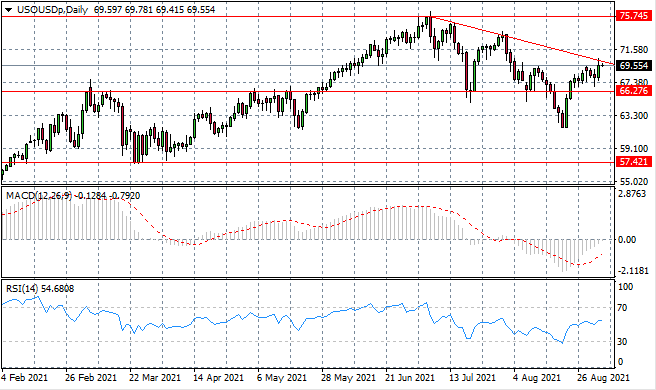
USOUSD
The USOUSD has rebounded back towards the descending trendline, yet selling pressure began to rise in yesterday’s trading. Price action appears likely to be contained by the trendline and will continue to oscillate within the current descending triangle. Momentum indicators are bullish.
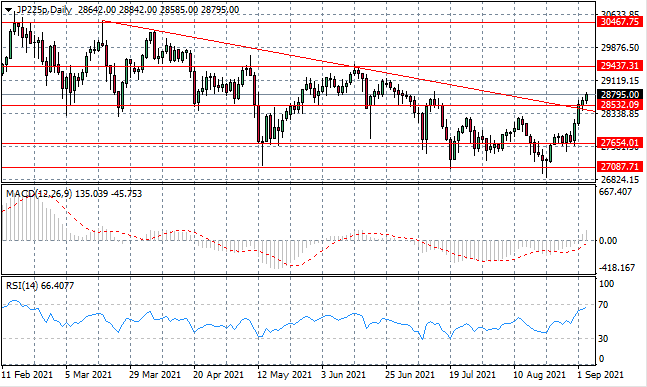
JP225
The JP225 has broken the descending trendline and 28,532 resistance line. Bullish conviction into the move appeared strong, yet recently, buying activity has become more subdued. The index may now languish in the 28,532- 29,437 trading range. Momentum indicators are bullish with RSI approaching overbought conditions.