Daily Insights Report 21/06/17
- 21 Jun 2017
EUR/USD
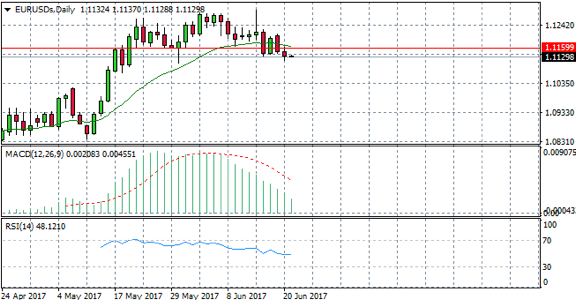
The EUR/USD pair has broken the 20-day exponential moving average and a previous support area at 1.115. The pair has been testing this area for the last few trading sessions, however, given the trajectory of MACD, the bearish momentum should continue. RSI is flat around the 50 support level.
Impact event: EIA Crude Oil Inventories data at 17:30 GMT+3, as the EUR/USD is positively correlated with oil prices.
GBP/USD
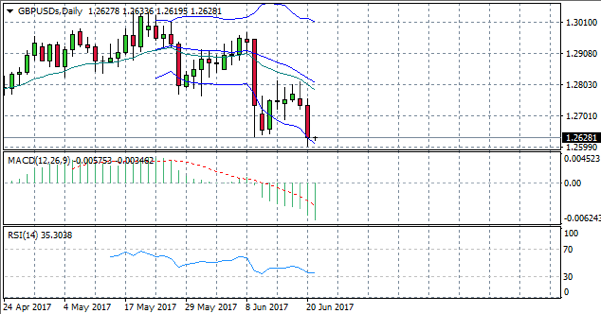
The GBP/USD pair appears to be oversold. A recent break of lower Bollinger band could indicate a retracement from the current downtrend. Each time the pair has broken this level it has resulted in a bullish retracement of the longer term bearish trend. RSI confirms the pair has reached oversold territory with a flattening of the indicator against the 30 support zone.
Impact event: U.K. Public Sector borrowing data at 11:30 GMT+3.
USD/CAD
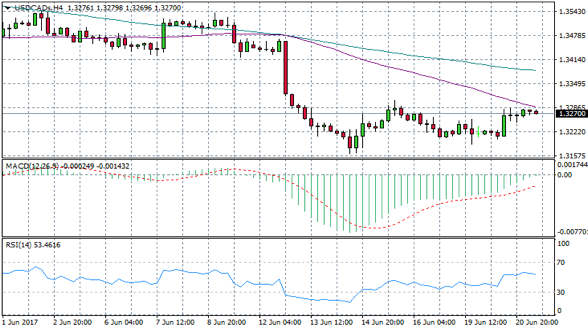
The USD/CAD is at a crossroads on the 4-hour chart. Momentum indicators provide a mixed story, with MACD still below the zero line with an upward trajectory. RSI has a slightly downward trajectory. Price action indicates an uptrend with higher highs and lower lows. However, a confirmation of the uptrend will come if price action is able to break the 50-day moving average to end the recent bearish trend.
Impact event: EIA Crude Oil Inventories at 17:30 GMT+3.
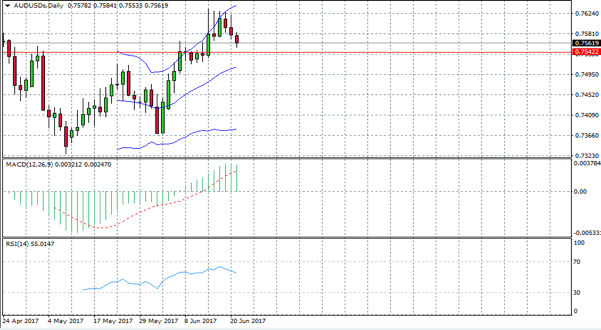
AUD/USD
The AUD/USD pair appears to have reached, and fallen back from, a market top. The pair spiked through upper Bollinger band, resulting in 3 consecutive bearish candles. The question of whether the downtrend will continue will be somewhat determined by the pair’s ability to break a support area at 0.754. MACD appears to be pulling back from strong bullish momentum and RSI has a marked downward trajectory.