Have Fortunes Turned For The British Pound?
- 14 Sep 2017
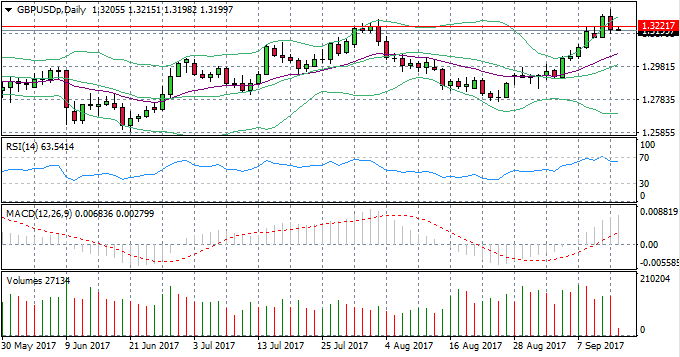
GBP/USD
The GBP/USD daily chart shows a break back below the upper Bollinger band and a bearish break of the 1.322 price level. RSI indicates that a bearish reversal is underway with a break below the 70 overbought line. Volume has dropped off the pace of the previous uptrend but appears to be rising, indicating increasing interest in the pair.
Impact event: The Bank of England Interest Rate decision will be released at 14:00 GMT+3 and will impact all GBP pairs.
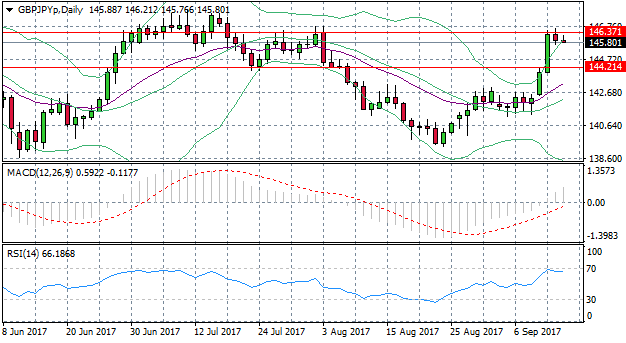
GBP/JPY
The GBP/JPY daily chart also appears to indicate a bearish reversal after having rejected the 146.37 price level, which represents a previous resistance level. Bearish candles indicate selling pressure and RSI has dropped below the 70 line, indicating a change in momentum. A full break below the upper Bollinger band will have price action targeting the 144.21 price level.
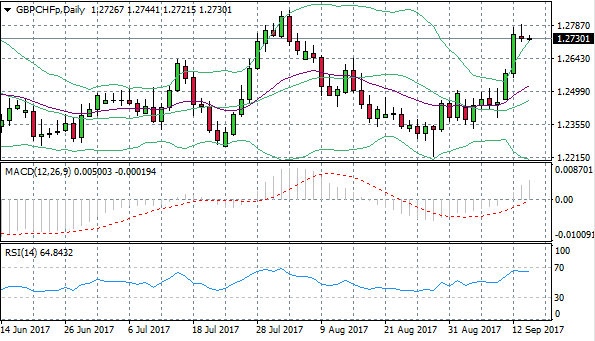
GBP/CHF
Sterling weakness continues its theme to the GBP/CHF pair. A shooting star candlestick formation in yesterday’s trading session, signals the market top after a strong uptrend. Again, RSI has fallen back from the 70 overbought line and flattened just below the resistance level. MACD is approaching the zero line indicating there may be some time before the reversal is fully formed. Perhaps there is still some indecision in the market.
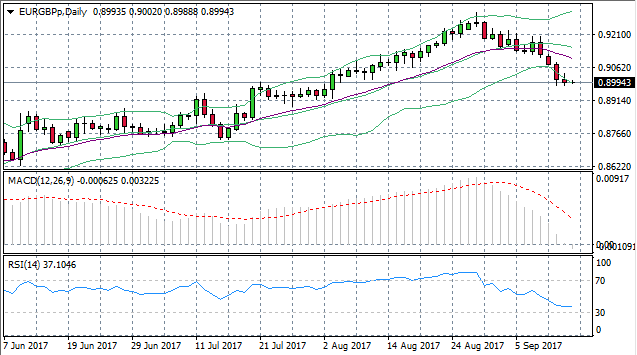
EUR/GBP
The Pound’s dominance against the Euro may be coming to an end. Several breaks of the lower Bollinger band indicate prices are trading below averages. MACD continues its downward trajectory, however, RSI has flattened just above the 30 support line. A bullish candle to break above the lower Bollinger band would indicate a change in sentiment.