A Trend Change For The NDX100?
- 1 Feb 2021
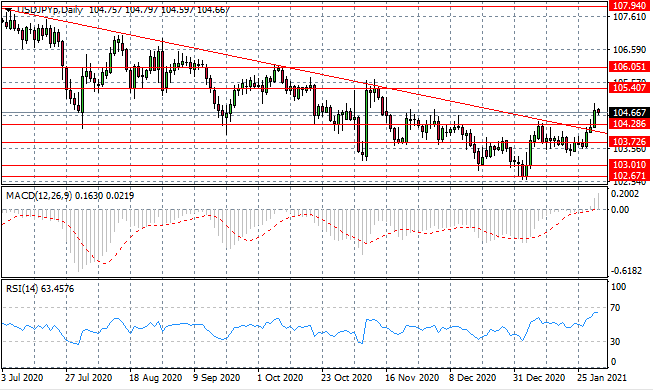
USD/JPY
The USD/JPY rally has begun to lose steam mid-range as selling pressure has begun to rise. Whether there is enough conviction from buyers to maintain this current trading range, remains to be seen. A break may required in order to gather support for another rally attempt. Momentum indicators have upward trajectories.
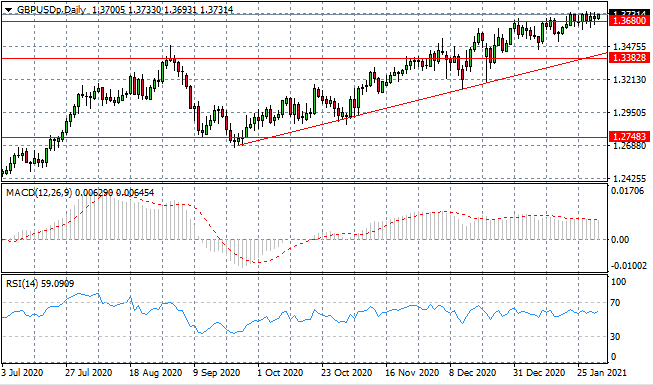
GBP/USD
The GBP/USD pair continues to float along the 1.368 resistance line with small-bodied candles indicating that neither buyers nor sellers are dominating price action. The status quo will likely continue unless there are any changes in fundamental factors. Momentum indicators have flattened in bullish territory.
EURUSD
The Eurodollar has stalled just below the 1.214 price line as a pullback from the previous rally. There appears to be little conviction currently to drive a trend change as the pair has not dropped as far as ascending trendline. Overall, the longer-term trajectory of price action remains bullish. Momentum indicators have flattened in bearish territory.

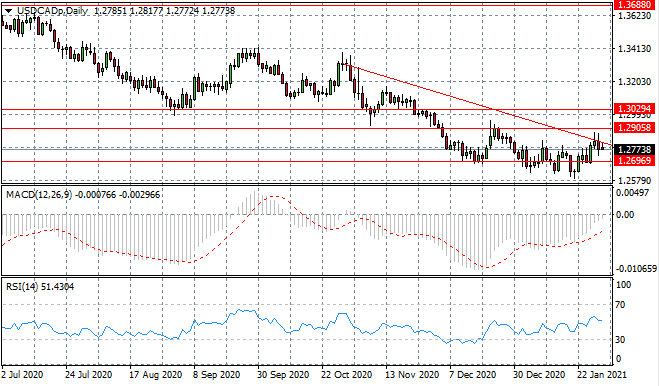
USDCAD
The USDCAD rally has been thwarted by the descending trendline, as selling pressure has begun to rise mid-range. The current trading range will likely remain intact with the 1.269 price level continuing to act as the floor. Overall, the longer-term bias has been bearish. Momentum indicators have moderate upward trajectories.
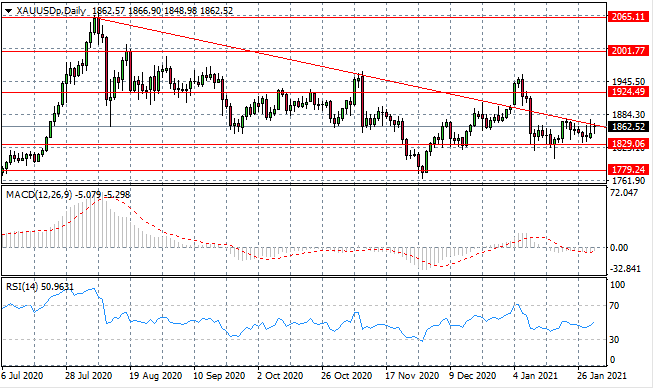
XAUUSD
The XAUUSD has had several tests of the descending trendline yet selling pressure remains, as the metal fails to clear this resistance area. The metal is moving closer to the apex of a descending triangle where a bearish breakout seems most likely. Momentum indicators have flattened in neutral territory.
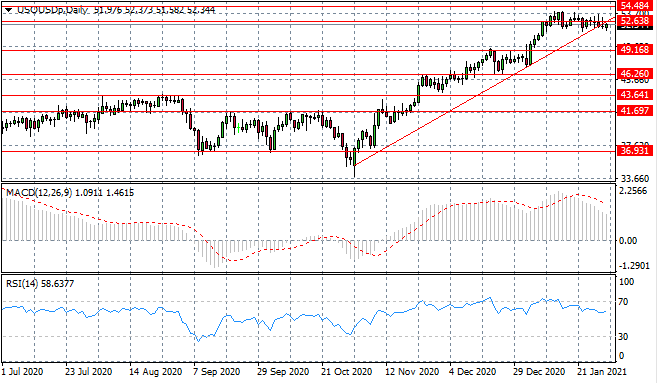
USOUSD
The USOUSD continues to float horizontally, just below the 52.63 price level. A break of the ascending trendline is, however, significant as it suggests that bearish momentum is beginning to influence price trajectory. Small-bodied candles indicate low conviction currently. Momentum indicators have downward trajectories.
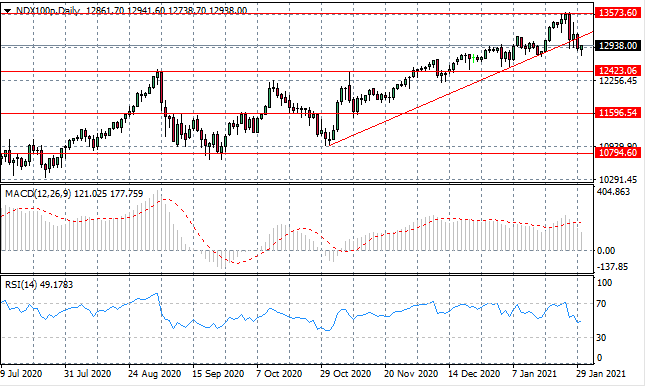
NDX100
The NDX100 index has pulled back below the ascending trendline, in the first sign a potential reversal of a previous rally. Buyers have since returned, however, the next target is the 12,423 support level which represents a previous resistance area. Momentum indicators have downward trajectories.