Bearish Breakout Ahead For XAUUSD
- 29 Jan 2021
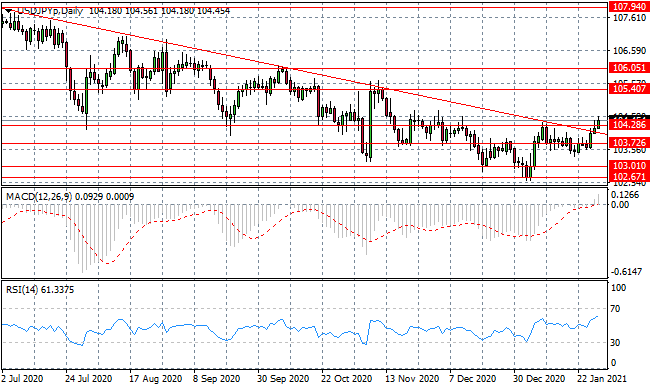
USD/JPY
The USD/JPY pair has broken both the descending trendline and the 104.28 resistance line to the upside. The move represents a return to a previous trading range between the 104.28 and 105.40 price levels. Given the longer-term bearish bias, buyers’ conviction will be tested. Momentum indicators have upward trajectories.
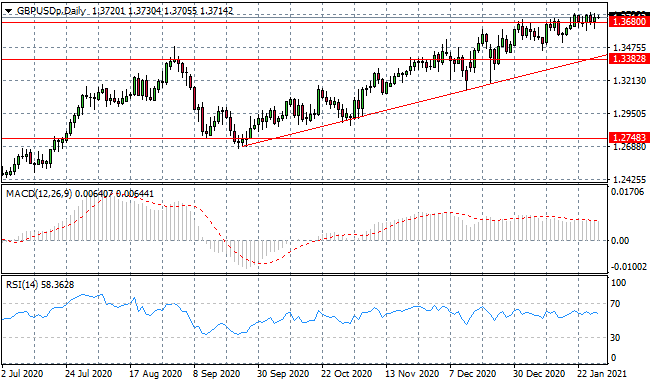
GBP/USD
The GBP/USD pair has been unable to fully establish a rally as the 1.368 resistance line remains a sticking point for the pair. As such price action has stalled at this price level and a period consolidation may continue until the economic landscape becomes clearer. Momentum indicators have flattened in bullish territory.
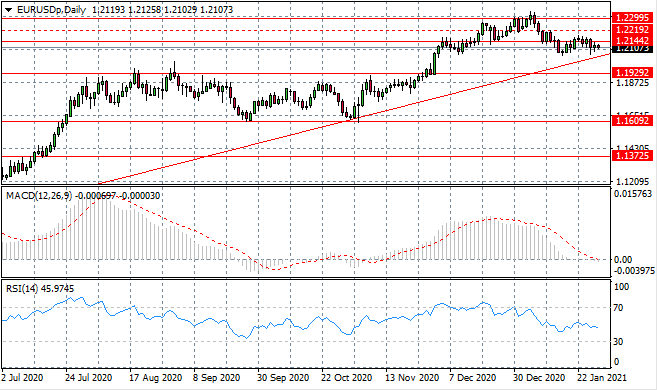
EURUSD
The Eurodollar has pulled back, although not as far as the descending trendline, as buyers have returned to hold price action closer to the 1.214 price area. Overall, the longer-term trajectory of price action has been bullish and currently, sellers appear to lack the appetite to change that. Momentum indicators have flattened in bearish territory.
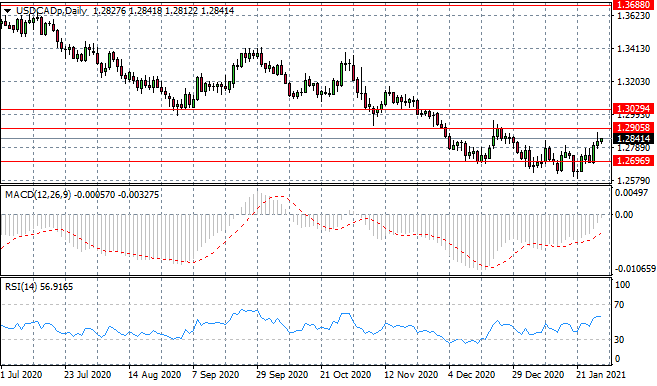
USDCAD
The USDCAD is continuing to make progress towards the 1.290 resistance line yet the move has become moderate after the break. Price action will likely oscillate between the 1.269 and 1.290 price levels, given that sellers are already becoming more active in the move. Momentum indicators have established upward trajectories.
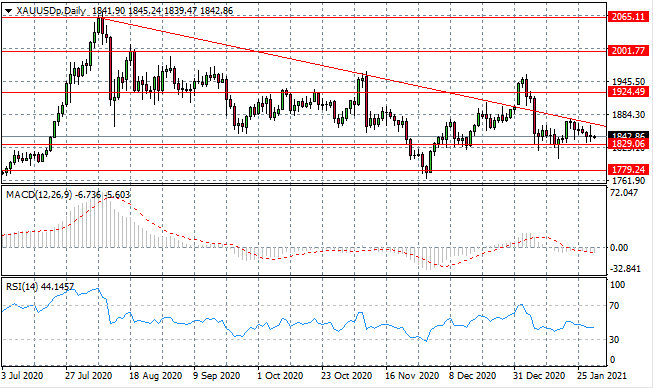
XAUUSD
XAUUSD is heading closer to the apex of a descending triangle and we can see oscillations narrowing and smaller-bodied candlesticks forming. The result will likely be a breakout, with a bearish move being the most likely given the pattern of price action. Momentum indicators have flattened in bearish territory.
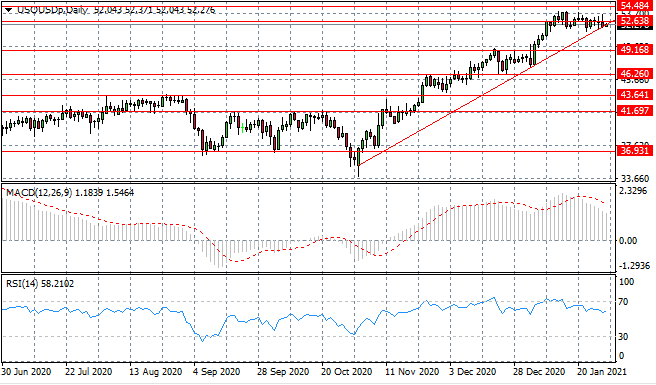
USOUSD
USOUSD has pulled back towards the ascending trendline as buyers have failed to make progress beyond the 52.63 resistance area. However, there is still little appetite from sellers to drive the reversal. If price action can break the ascending trendline, sellers may be able to build enough interest/momentum to drive the reversal. Momentum indicators have downward trajectories.
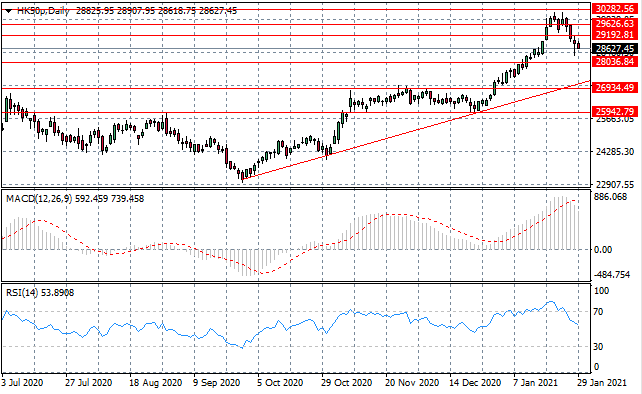
HK50
The HK50 index is pulling back towards the 28,036 support level, although there may be some tussle with buyers as the index moves closer to this price level. Longer-term, the bias is bullish with an ascending trendline acting as a key support level. Momentum indicators have downward trajectories.