US500 Tests Price Ceiling
- 8 Dec 2021
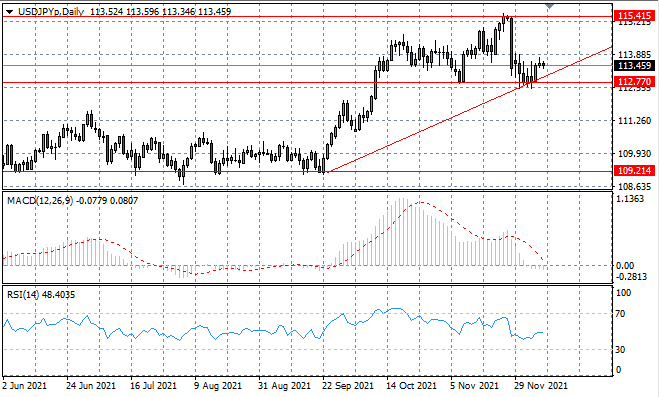
USD/JPY
The USDJPY pair has begun to stall mid-range, as a series of doji candles indicate bullish momentum is waning. Pullbacks have typically rebounded from the 112.70 support line and the trendline is now being established as a support area for the pair. Momentum indicators have flattened in neutral/bearish conditions.
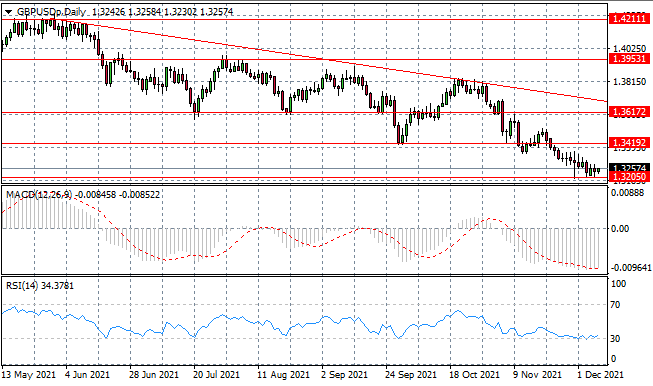
GBP/USD
The GBPUSD pair has begun to level off at the 1.320 support level, as a series of doji candles indicate conviction is waning for sellers, yet buyers lack the support to drive a rally. Price action may therefore consolidate at the current price level until a change in fundamentals. Momentum indicators have flattened in oversold territory.
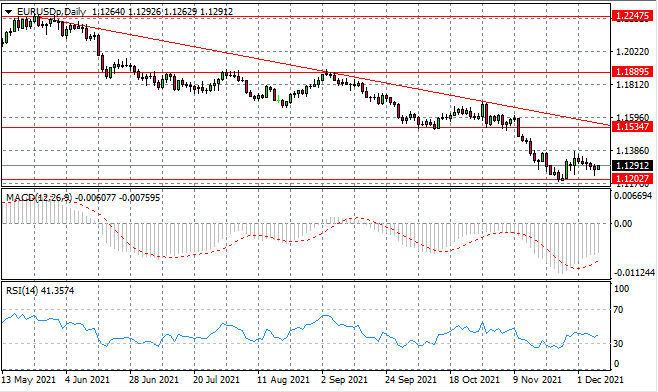
EURUSD
The EURUSD is beginning to float back towards the 1.120 support line as buyers have lost steam. Small-bodied candles reveal low activity in the pair after a sell-off period in recent trading. Momentum indicators have flattened in bearish territory after making a moderate bullish recovery.
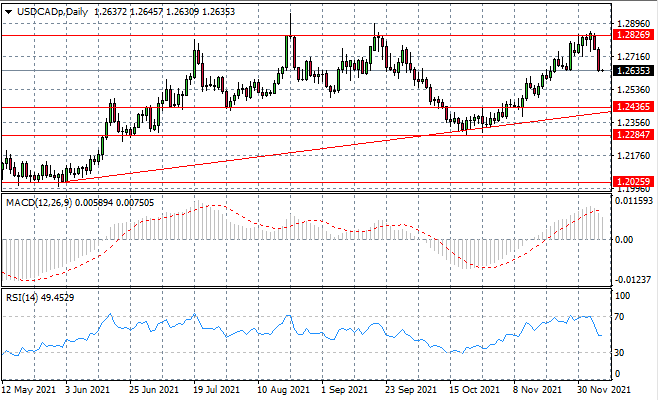
USDCAD
The USDCAD sell-off is beginning to build momentum, as heavy selling activity is taking price action towards the mid-line of a consolidation channel. The bearish sentiment coincides with strength in oil markets rather than appetite for the Canadian dollar. Momentum indicators are also undergoing bearish reversals.
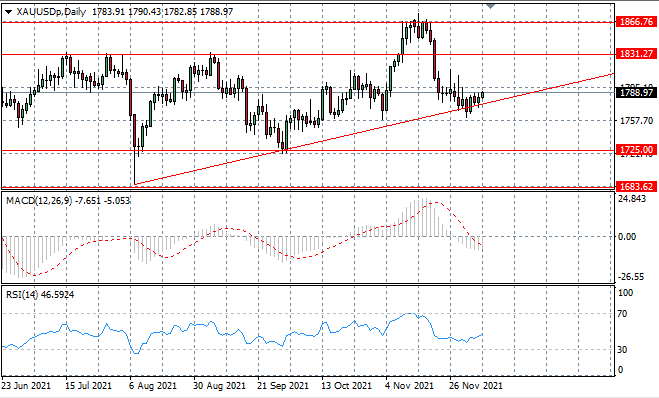
XAUUSD
XAUUSD price action is continuing to float along the ascending trendline with moderate bullish sentiment containing price action. A longer-term uptrend appears to be forming, with higher lows. Momentum indicators remains in bearish territory with sharp upward trajectories.
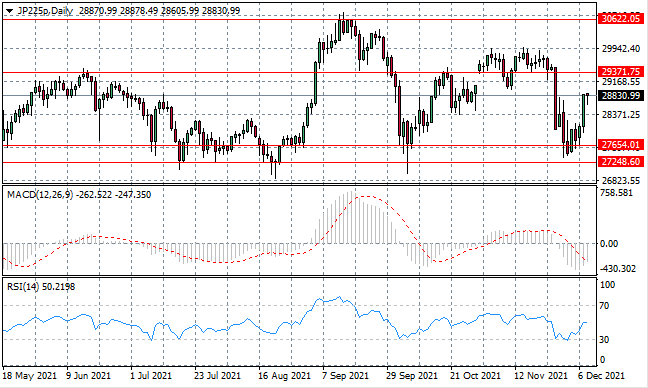
JP225
JP225 index is climbing back towards the 29,371 resistance line due to a sharp rise in buying activity. A hammer candle mid-rally indicates that bullish momentum may not last and the consolidation channel will once again remain intact. Momentum indicators have upward trajectories.
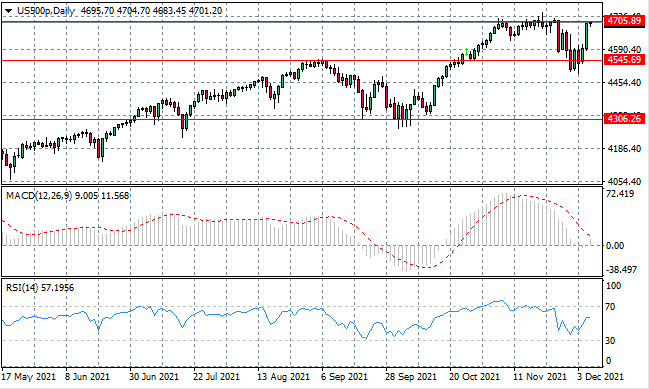
US500
The US500 index is testing the 4705 resistance line which also represents a recent price ceiling and an area from which bearish moves have resulted from previous tests. Bullish conviction has been strong into the move and therefore support may be sufficient for a break to a new high. Momentum indicators have upward trajectories.