Will The USD/CAD Reverse From A Recent Price High?
- 28 Feb 2020
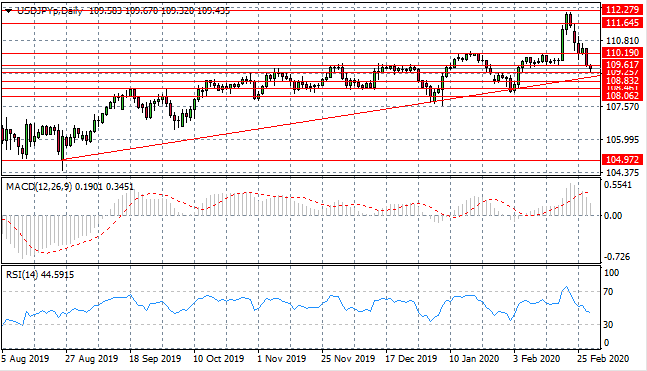
USD/JPY
The USD/JPY sell-off has taken price action back to a previous trading range between the 108.06 110.19 price levels. Sentiment has turned significantly bearish with price action testing the 109.61 resistance level. A support level exists at the ascending trendline which price action has rejected on previous occasions. Momentum indicators have sharp bearish trajectories.
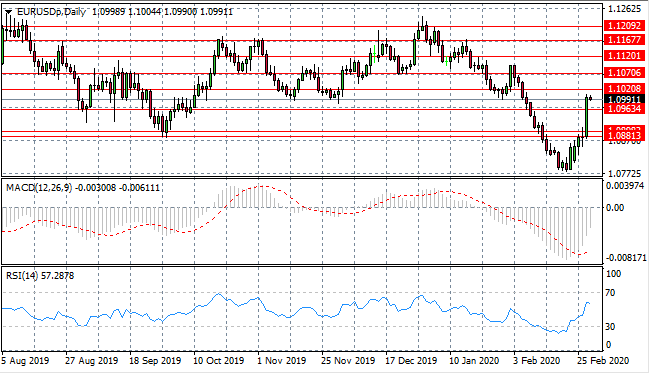
EUR/USD
The Eurodollar has found significant support with price action surging through a series of resistance levels in yesterday’s trading. The pair is now heading towards the 1.102 resistance line as a full reversal is established. Is there further upside? Momentum indicators support bullish sentiment with sharp upward trajectories.
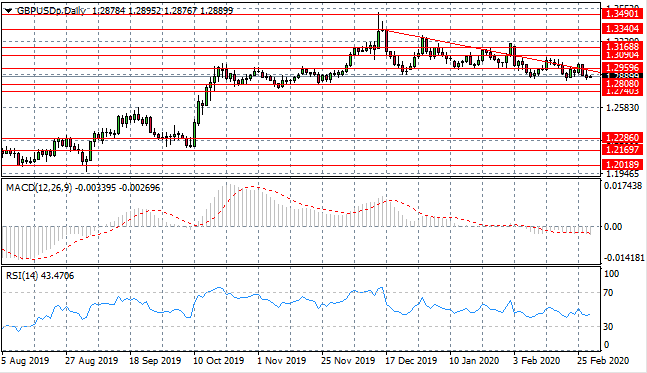
GBP/USD
The GBP/USD pair continues to oscillate around the descending trendline with oscillations becoming narrower as the downtrend continues. A breakout seems imminent given the pattern of price action and if the pair tests the 1.280 price level, a bearish breakout seems likely. Momentum indicators have flattened in neutral/bearish territory.
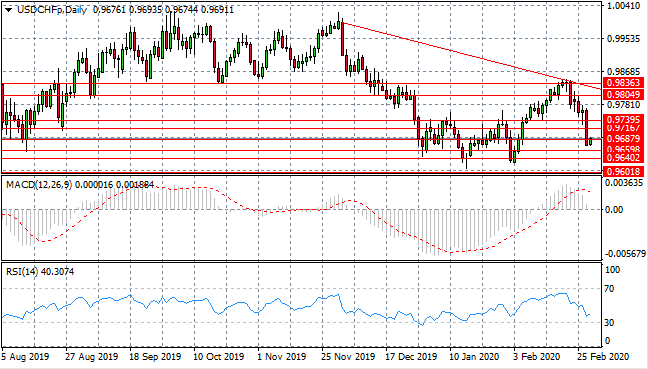
USD/CHF
The USD/CHF pair has come under pressure from sellers as yesterday’s trading saw the pair move through several support lines to stall just after the break of the 0.968 price level. The move has seen buyers return in early trading, as the price level remains a key pivot point in the pair. Momentum indicators have downward trajectories.
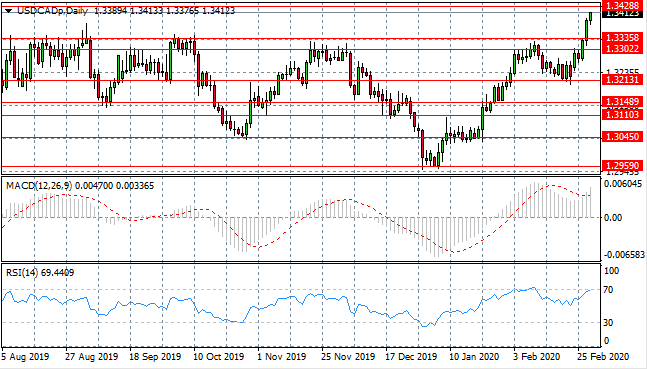
USD/CAD
USD/CAD is reaching new highs as oil prices continue to slump. The next target for the pair is the 1.342 resistance level as buyers dominate price action. Will a reversal take place at this price level or will fundamental factors drive price action? Momentum indicators suggest that a reversal may be on the cards with RSI approaching overbought territory.
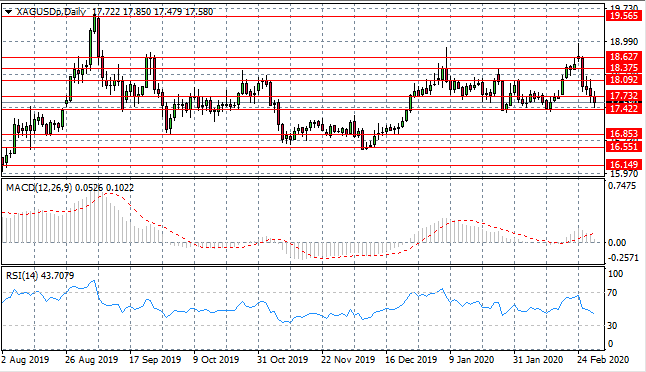
SILVER
Silver has established a trading range between the 17.42 and 18.62 price levels. Despite recent moves having a bearish bias, candlesticks indicate some battle between buyers and sellers with long upper and lower shadows. A rebound from the 17.42 floor appears to be underway. Momentum indicators have moderate downward trajectories.
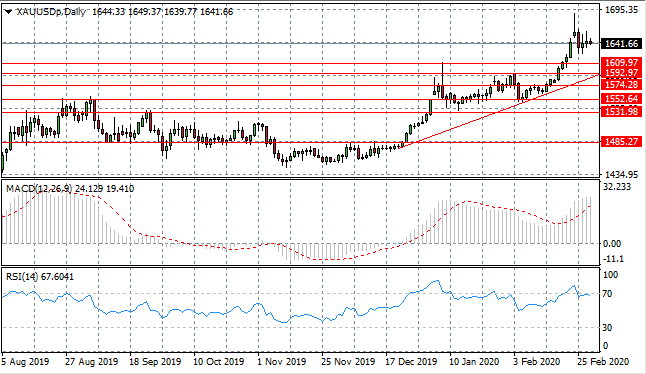
GOLD
Gold buyers are struggling to push price action beyond the 1641 price level as selling pressure remains. A series of doji candles indicate a lack of conviction/uncertainty from market participants. A reversal or pullback is possible despite the commodity forming a longer-term uptrend. Momentum indicators remain in bullish territory, however RSI continues to test the 70 resistance area.
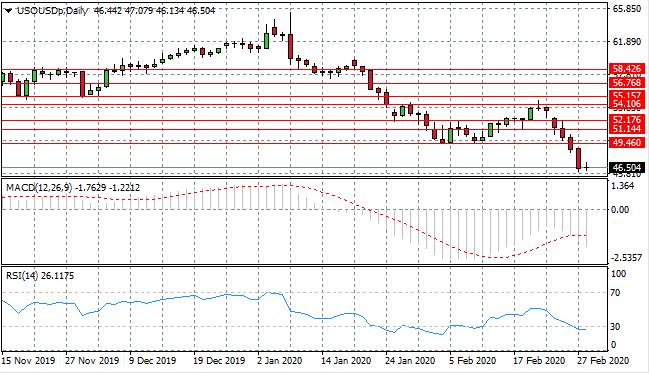
OIL
WTI sentiment has turned bearish as the Covid-19 virus continues to spread, with significant numbers infected in the Middle East; where the majority of the global oil supply is located.Will WTI test the $40 per barrel range to the downside? Momentum indicators suggest the sell-off may be coming to an end with RSI testing oversold conditions.